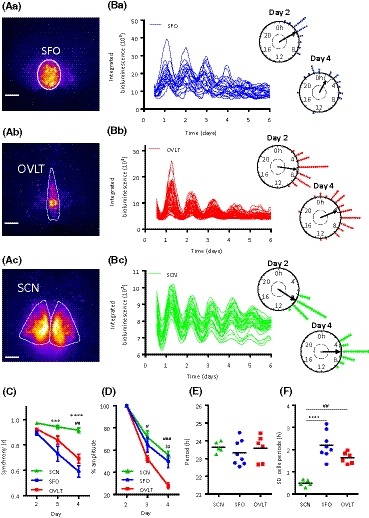
Figure 1.

Circadian rhythms in the SFO and OVLT. False‐colored representative image of bioluminescence expression in the (Aa) SFO, (Ab) OVLT, and (Ac) SCN of coronal brain slice explants, where warmer colors indicate higher expression. White bars depict 100 µm. Note the increased density of putative single cells in the SFO vs the OVLT. Example traces of putative single‐cell bioluminescence from the (Ba) SFO, (Bb) OVLT, and (Bc) SCN, and their corresponding Rayleigh plots showing peak phase clustering of these individual cellular oscillations on day 2 and day 4 of the recording. Circles represent peak bioluminescent phases for individual cells (blue = SFO; red = OVLT; green = SCN), the arrow indicates the phase vector and the arrow length represents significance with respect to the inner dashed circle detailing the (P = .05) significance threshold. Variance is represented by the black box adjacent to the arrow head. C, Phase clustering of individual cells in the SCN, SFO and OVLT for peaks 2‐4 (calculated using the Rayleigh r value); the SCN is more synchronized than the SFO on days 3 and 4 and more synchronized than the OVLT on day 4. Two‐way RM ANOVA, Tukey's multiple comparisons test SCN vs SFO ***P < .001 ***P < .0001, SCN vs OVLT## P < .01. Data are mean ± SEM. D, Damping (relative to the amplitude of the peak in day 2) is reduced in the OVLT vs the SCN on days 3 and 4, and reduced in the OVLT vs SFO on day 4. Two‐way RM ANOVA, Tukey's multiple comparisons test, SCN vs OVLT # P < .05 ### P < .001, SFO vs OVLT $$P < .01. Data are means ± SEM. E, The period of single‐cell oscillations does not differ between the SCN, SFO, and OVLT, F, but the standard deviation (SD) of these individual cellular periods is reduced in the SCN compared with the SFO and OVLT. One‐way ANOVA, Tukey's multiple comparisons test SCN vs SFO ****P < .0001. SCN vs OVLT ## P < .01. Black horizontal lines represent the mean value. RM = repeated measures
