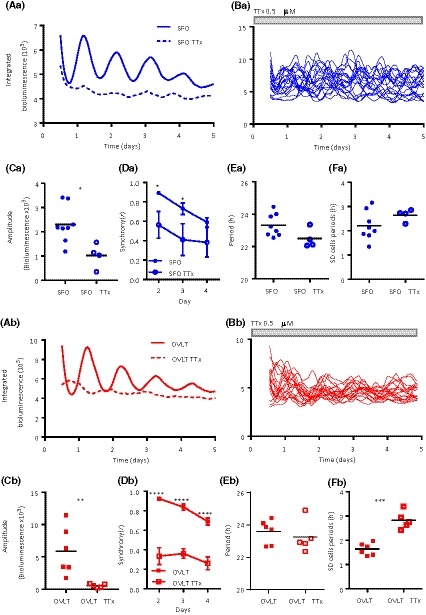
Figure 4.

Tetrodotoxin treatment decreases single‐cell synchrony. Representative mean traces of individually oscillating single cells recorded during control baseline and in the presence of TTx for the (Aa) SFO and (Ab) OVLT and their corresponding individual cell traces (Ba; SFO, Bb; OVLT) during the TTx recordings, grey‐filled bar indicates TTx duration. Note that while individual cells continue to oscillate, they are not in synchrony with one another. Whole area bioluminescence amplitude is significantly decreased for control baseline vs TTx treatment in the (Ca) SFO (t test *P < .05) and the (Cb) OVLT (Unpaired t test *P < .05). TTx treatment decreases the synchrony of individually oscillating cells during days 2 and 3 of the recording in the (Da) SFO and (Db) days 2‐4 in the OVLT. Two‐way RM ANOVA, Sidak's multiple comparisons test *P < .05, ****P < .0001. Data are means ± SEM. The mean period of the single‐cell oscillations is not affected by TTx treatment in the (Ea) SFO and (Eb) OVLT, with the (F) variability in these cellular periods being greater in the (Fb) OVLT. Unpaired t test, ***P < .001. Duration of TTx treatment is denoted by the gray‐filled bar. Black horizontal lines represent the mean value. RM = repeated measures. TTx = tetrodotoxin
