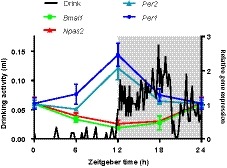
Figure 6.

Expression of Per1‐2 in the SFO is high at the onset of drinking activity. Schematic of relative in vivo gene expression of Per1‐2, Bmal1, and Npas2 in the SFO (data from Figure 2), overlaid with 5‐day average 24‐hours drinking profile of a C57BL6/J male mouse. Gray shading represents lights‐off
