Figure 1.

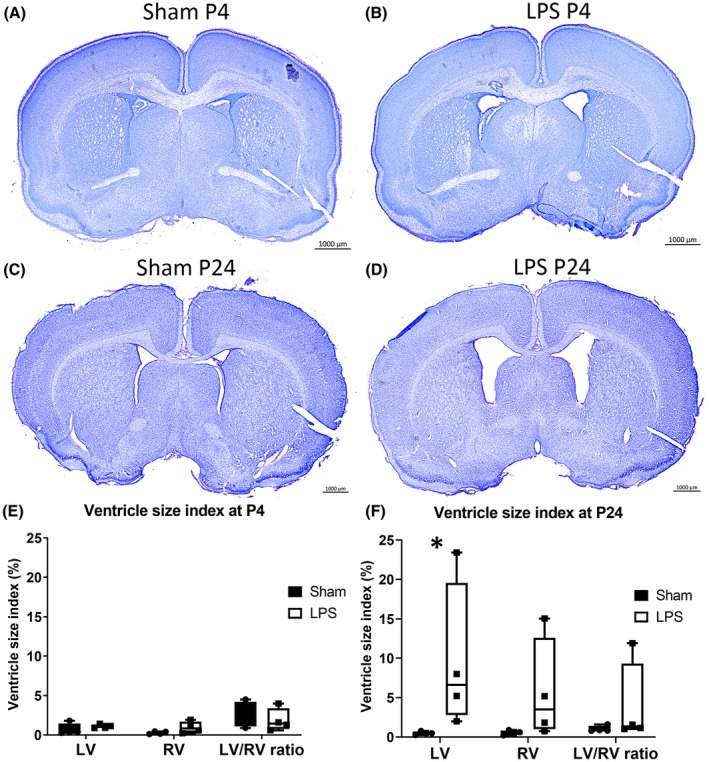
Lateral ventricles size index at P4 and P24. Representative image of lateral ventricle size for Sham and LPS animals at P4 (A and B) and at P24 (C and D). Bar graph of ventricle size at (E) P4 and (F) P24. *P < .05 compared to Sham. LV, left ventricle; RV, right ventricle
