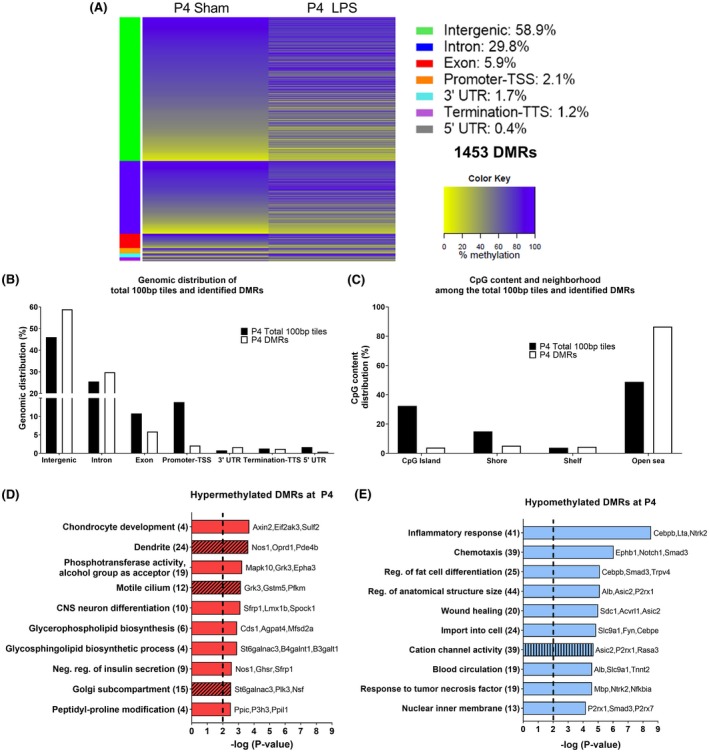
Figure 2.

DNA methylation alteration at P4 in the brain of Sprague‐Dawley rats exposed to neonatal WMI. A, Heat map of mean methylation levels for 1453 DMRs with methylation alteration in the LPS group (n = 4) compared to Sham (n = 4) at 24‐h post‐injection. B, Genomic distribution of total 100 bp tiles and the 1453 DMRs. C, CpG content and neighborhood in total 100 bp tiles and DMRs (D‐E) Top 10 pathways identified following GO analysis without intergenic DMRs for (D) hypermethylated DMRs and (E) hypomethylated DMRs. GO enrichment was performed for biological processes (plain bar), molecular functions (bar with vertical lines), and cellular components (bar with oblique lines). The number of genes associated to each pathway is in parenthesis. LINE, long interspersed nuclear element; LTR, long terminal repeat element; SINE, short interspersed nuclear element
