FIGURE 4.
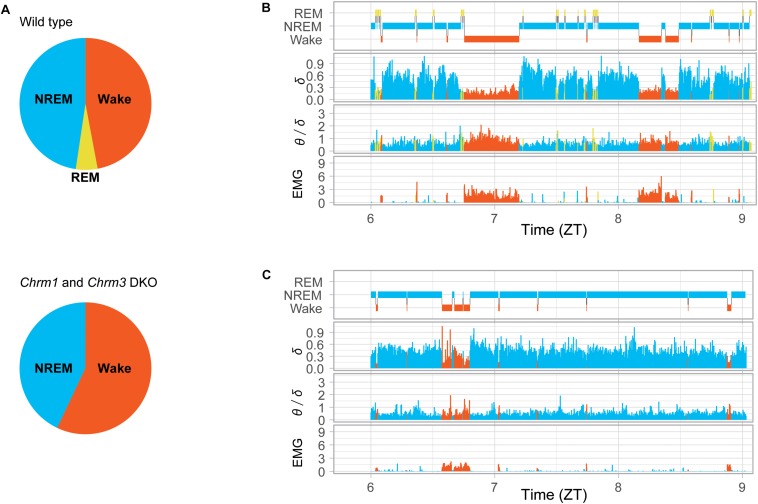
Power of EEG theta and delta oscillations in Chrm1 and Chrm3 DKO mice. (A) Pie charts presenting the proportions of sleep stages detected in wild-type mice (top) and double knockout (DKO) mice (bottom). REM sleep in wild-type mice was 72 min a day while almost undetected in DKO mice. (B) Hypnogram of a wild-type mouse. Delta power (normalized mV2), the ratio of theta/delta power, and total power of EMG signal. (C) Hypnogram of a Chrm1 and Chrm3 DKO mice. Orange for wakefulness, yellow for REM, and blue for NREM are shown. The enrichment of theta oscillation (increase in the value of θ/δ), that is associated with REM sleep in (A), was hardly detected during sleep in the DKO mice (C). The plots were reproduced from the data published in the literature (Niwa et al., 2018).

