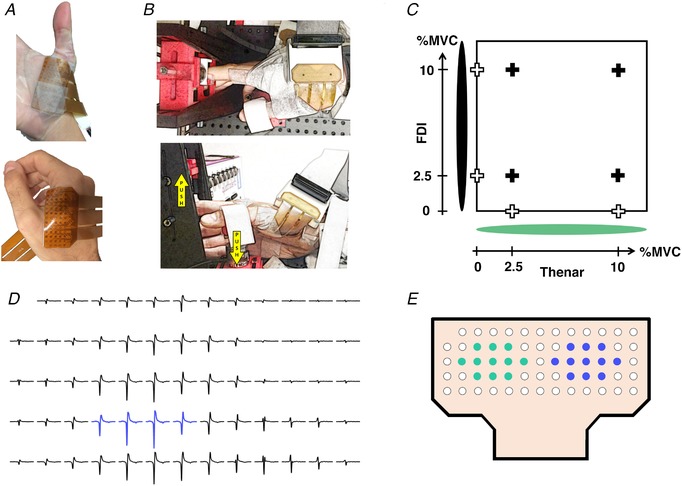
Figure 1. Experimental set‐up and data analysis.

A, two high‐density surface EMG grids of 64 electrodes, each placed on the thenar and first dorsal interosseous (FDI) muscles (top and bottom row, respectively). B, the experimental apparatus that was used for the index finger abduction and thumb flexion isometric contractions (top and bottom row, respectively). The yellow arrows indicate the force directions for the hand digits. C, visual feedback shown as a cursor in which the x‐axis corresponded to the force of the thumb flexion and the y‐axis to the force of the index finger abduction. The eight contraction conditions are marked with crosses (individual contractions for the index finger and thumb: white crosses; simultaneous contractions: black crosses). Two LEDs were used to indicate the onset of contraction and the finger active (green light). MVC, maximal voluntary contraction. D, selection of four consecutive electrodes with the greatest amplitude to estimate motor unit action potentials through monopolar electrode derivation. E, two groups of 11 electrodes used to estimate the bipolar derivation. [Color figure can be viewed at http://wileyonlinelibrary.com]
