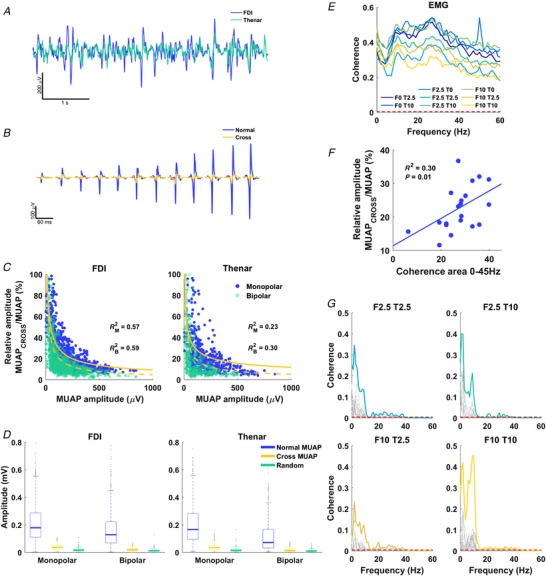
Figure 2. Coherence from EMG signals: influence of cross‐talk.

A, global EMG signals for first dorsal interosseous (FDI) and thenar muscles (blue and green curves, respectively). B, FDI motor unit action potentials (MUAPs) extracted by spike‐triggered averaging the FDI EMG (blue) and the thenar EMG (cross MUAP, orange). C, ratio between the amplitude of the MUAP in one muscle triggered by the MUAP in the other muscle (cross MUAP) normalized by the amplitude of the trigger MUAP with monopolar and bipolar derivations. D, box plot of the amplitude of the regular, cross and random MUAP for FDI and thenar with monopolar (left) and bipolar (right) EMG signals (median, 25th and 75th percentiles are given). E, mean coherence between FDI and thenar EMG of all subjects at frequencies up to 60 Hz for all contraction conditions; contraction conditions are indicated by the intensity of contraction (0, 2.5 or 10% MVC) of FDI (F) and thenar (T). Dashed red lines denote 95% confidence level for statistical significance. F, relationship between relative amplitude of cross and normal MUAP to coherence area of the spectrum up to 45 Hz for each contraction condition (circles). G, coherence between cumulative spike trains for FDI and thenar for simultaneous contraction conditions. Each spectrum in grey represents a trial, and colour lines the pooled coherence for all trials (see Methods). Data in C–G are from all subjects. [Color figure can be viewed at http://wileyonlinelibrary.com]
