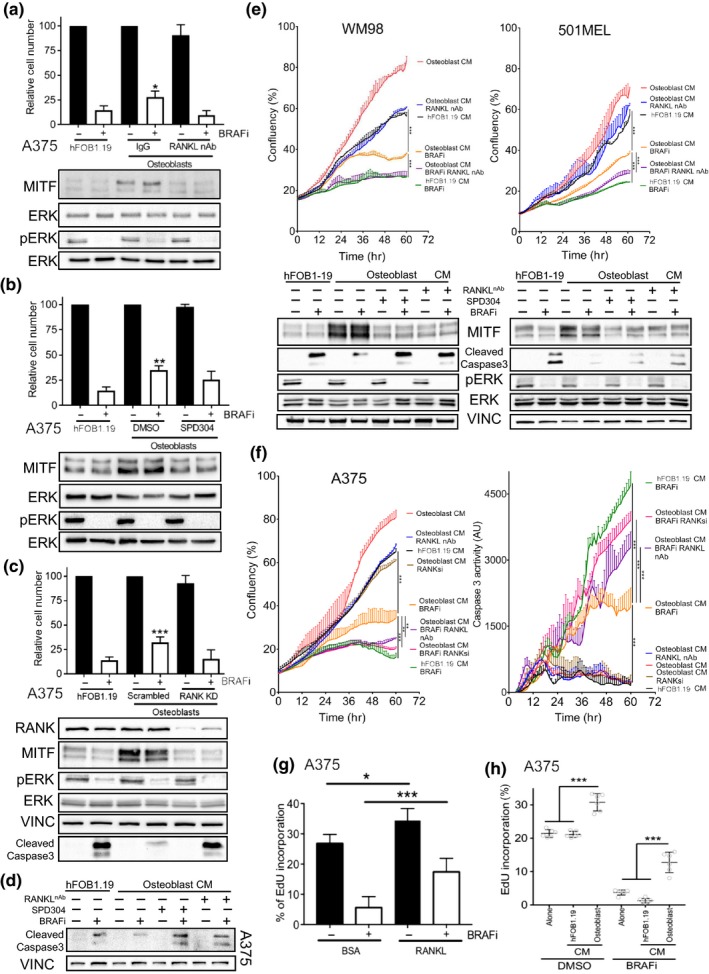
Figure 5.

Osteoblasts provide a BRAF inhibitor protective niche via RANKL secretion (a). Relative cell number and protein expression of MITF, phospho‐ERK, and ERK in A375 cells following 72 hr treatment with/without 0.5 µM vemurafenib. Cells were co‐cultured with either hFOB1.19 or osteoblast in transwells with addition of 40ng/ml RANKL nAb or IgG. (Mean ± SEM, n = 7) (b). Relative cell number and protein expression of MITF, phospho‐ERK, and ERK in A375 cells co‐cultured with either hFOB1.19 or osteoblasts in transwells and treated for 72 hr with/without 0.5 µM vemurafenib in addition of 10 µM SPD304. (Mean ± SEM, n = 7) (c). Relative cell number and protein expression of MITF, phospho‐ERK, RANK, VINCULIN, cleaved‐CASPASE3 and ERK in A375 cells; following 72 hr treatment with/without 0.5 µM vemurafenib grown in the presence of co‐culture transwells with either hFOB 1.19 or osteoblasts. Melanoma cells had either been transfected with a Scrambled control or a RANK specific siRNA (Mean ± SEM, n = 3) (d). Protein expression of VINCULIN and Cleaved‐CASPASE3 in A375 cells; following 72 hr treatment with/without 0.5 µM vemurafenib grown in incubated in indicated CM from either hFOB 1.19 or osteoblasts, in the background of 40ng/ml RANKL nAb or 10 µM SPD304 (e). Growth curves of indicated cell lines with or without BRAFi (vemurafenib 1 µM) incubated in indicated CM from either hFOB 1.19 or osteoblasts, in the background of 40ng/ml RANKL nAb. Confluency was measured using time‐lapse microscopy using the Incucyte system (Mean ± SD, n = 3). Protein expression of MITF, phospho‐ERK, VINCULIN, Cleaved‐CASPASE3 and ERK in indicated cell lines under described treatment conditions (f). Growth curves of indicated cell lines with or without BRAFi (vemurafenib 0.5 µM) incubated in indicated CM from either hFOB 1.19 or osteoblasts, in the background of 40ng/ml RANKL nAb or siRNA mediated depletion of RANK (20nM). Confluency measured using time‐lapse microscopy and assessment of CASPASE3 activity assayed using cleavage activated Incucyte Dye reagent using the Incucyte system (Mean ± SD, n = 3) (g). Quantification of the population of A375 cells in S‐phase using EDU incorporation after 72 hr of treatment with 0.5 µM vemurafenib or DMSO in the presence or absence of 50ng/ml RANKL (Mean ± SEM, n = 3) (h). Quantification of the population of A375 cells in S‐phase using EDU incorporation after 72 hr of treatment with 0.5 µM vemurafenib or DMSO in the presence of CM from either hFOB 1.19 or osteoblasts. (Mean ± SEM, n = 6)
