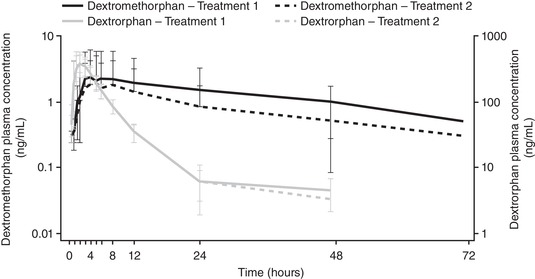
Figure 2.

Mean plasma concentration‐time profile for dextromethorphan and dextrorphan by treatment, with log scale (pharmacokinetic set, n = 18).a Treatment 1: digoxin 0.5 mg and dextromethorphan 30 mg administered on day 1. Treatment 2: maribavir 400 mg (2 × 200 mg) twice daily from days 8 to 15. On day 13, digoxin 0.5 mg and dextromethorphan 30 mg was administered with the morning dose of maribavir 400 mg (2 × 200 mg). Error bars represent the standard deviation. aSamples with concentrations of less than the LLOQ (0.2 ng/mL for dextromethorphan and 2.5 ng/mL for dextrorphan) were treated as zero when calculating mean concentration.
