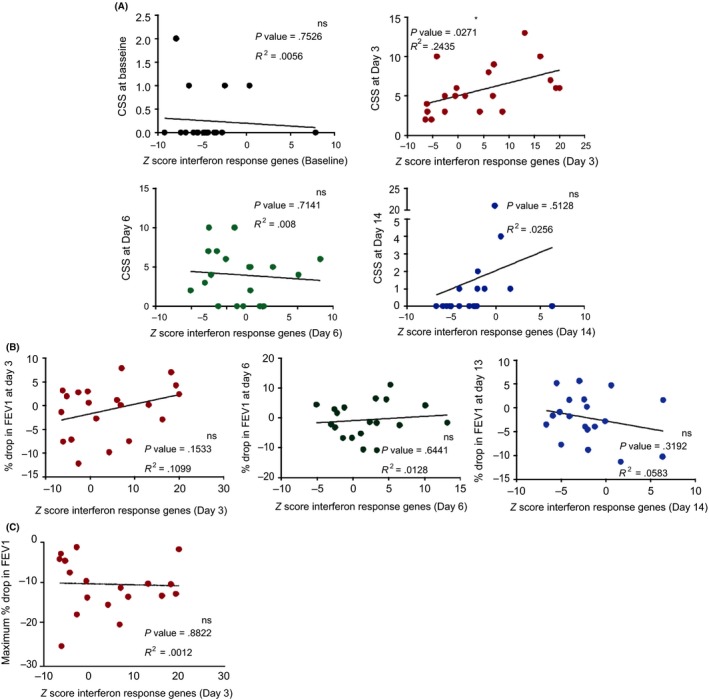
Figure 5.

Interferon response gene expression in nasal epithelium at day 3 correlates with peak of upper airway symptoms. A, Cold Symptom Score (CSS) correlated with Z scores of interferon response genes only at day 3 (red) at which there was the highest expression of interferon response genes. While at baseline (black), day 6 (green) and day 13 (blue), there was no correlation observed between CSS and interferon response genes at their respective time‐points (Pearson's correlation coefficient). B, The Z scores of interferon response genes did not correlate with the drop in % FEV1 measured at day 3 (n = 20), day 6 (n = 19) and day 13 (n = 19) and C, also the maximum drop in % FEV1 over 14 d after RV16 (n = 20). All correlations were performed using Pearson's correlation coefficient
