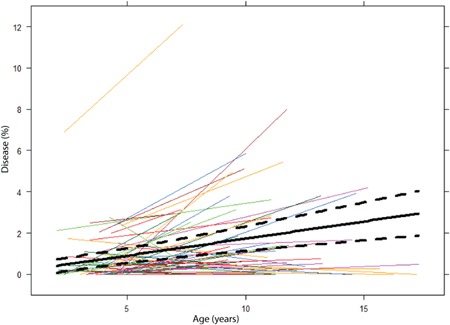
Figure 2.

%Disease over time. This figure shows the progression of %disease of individual patients from their preschool CT up to the moment of their last school‐age CT. The black solid line represents the average evolution over time obtained by the linear regression model, while the dashed lines represent the confidence intervals. CT, computed tomography [Color figure can be viewed at wileyonlinelibrary.com]
