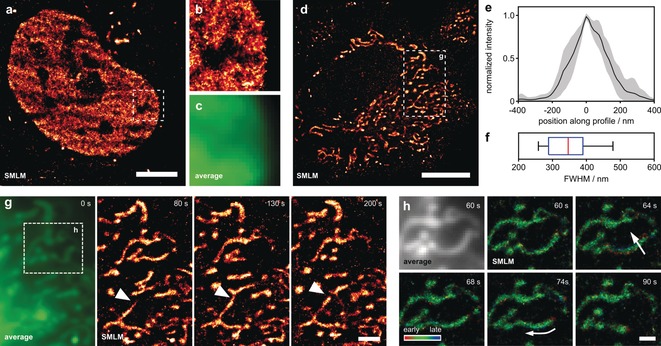
Figure 4.

f ‐HM‐SiR reveals cellular dynamics in live HeLa cells with improved resolution. a) HeLa cells transiently expressing H2A‐HaloTag were incubated with HTL‐BCN (10 μm), washed and labeled with f ‐HM‐SiR (2 μm). A reconstruction from 333 frames corresponding to 6.67 seconds acquisition time is shown. b) Zoom‐in of boxed region in (a). c) Corresponding averaged image for boxed region in (a). d) HeLa cells were incubated with TPP‐BCN (10 μm), washed, and labeled with f ‐HM‐SiR (2 μm). Reconstruction from 500 frames (10 seconds) is shown. e) Averaged cross‐sectional profiles from mitochondrial tubules after alignment, ±1 standard deviation, n=11. f) Width of individual profiles shown in (e). See Figure S11 in the Supporting Information for position off all profiles. g) Zoom‐in of boxed region in (d). Average (left) and reconstructions from 500 frames at different time points (right). Arrowhead indicates mitochondrial fusion event. h) Average (top left) and reconstructions of boxed region in (g). Localizations are colored with respect to their relative time of appearance within a single reconstruction. Scale bars: a) 5 μm, d) 10 μm, g) 2 μm, h) 1 μm.
