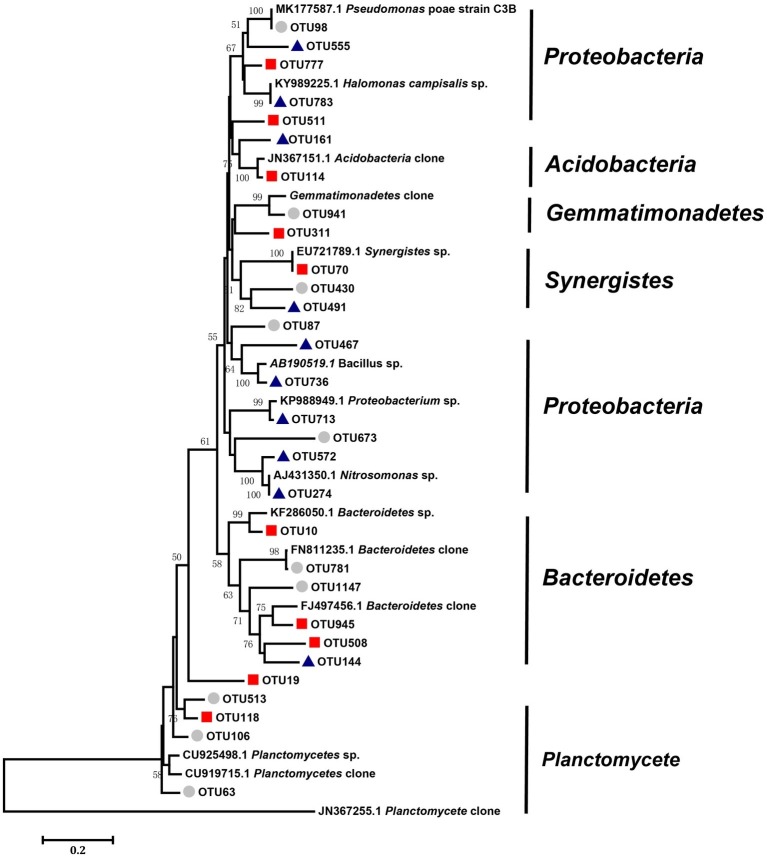
Figure 6.
Neighbor-joining analysis of key OTUs forms the networks of three different salinity treatments (low, middle, and high). Bootstrap values higher than 40% are indicated at branch nodes. The scale bar represents 2% nucleic acid sequence divergence. The key OTUs as circles represent OTUs in the low-salinity treatment (EC: 0–2); the key OTUs as squares represent OTUs in the middle-salinity treatment (EC: 2–4); and the key OTUs as triangles represent OTUs in the high-salinity treatment (EC:>4).

