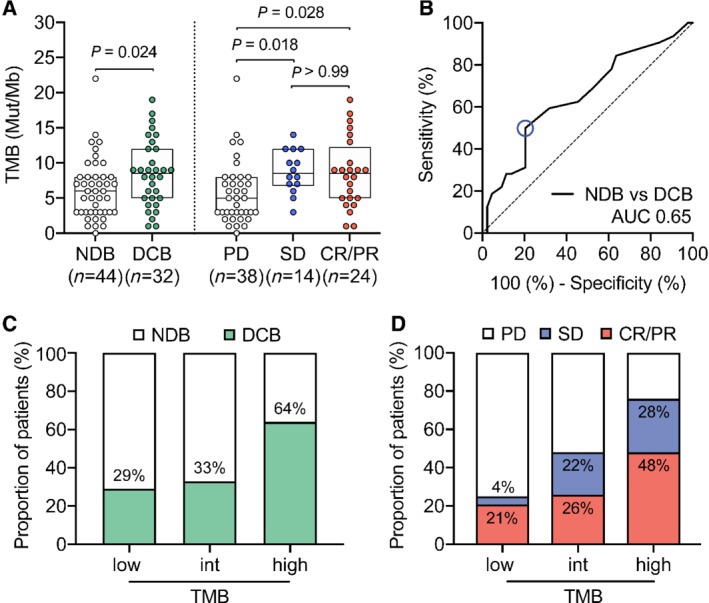
Figure 2.

TMB correlates with response to ICI treatment in NSCLC patients. (A) Left panel: TMB in patients with NDB (n = 44, median = 6 Mut/Mb) versus patients with DCB (green, n = 32, median = 8.5 Mut/Mb) (Mann–Whitney p = 0.024). Right panel: TMB in patients with PD (n = 38, median = 5 Mut/Mb), SD (blue, n = 14, median = 8.5 Mut/Mb), and CR/PR (red, n = 24, median = 8.5 Mut/Mb) (Dunn's multiple comparisons test, p = 0.018, 0.028, and 0.99). (B) Receiver operating characteristic (ROC) curve to illustrate the ability of TMB to discriminate durable clinical benefit [NDB n = 44 versus DCB n = 32, AUC 0.65 (95% CI 0.52–0.78), p = 0.025]. (C) Percentage of patients with DCB (green) or (D) PD, SD (blue), CR/PR (red) falling into TMB‐low (≤ 4 Mut/Mb), ‐intermediate (5 < x < 9 Mut/Mb), and ‐high group (≥ 9 Mut/Mb).
