
Figure 4.
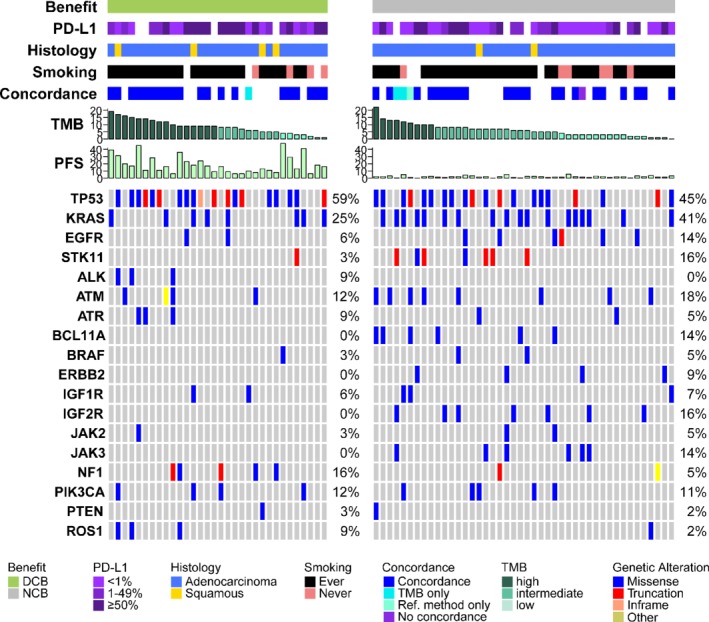
Overview of the clinical and molecular features associated with DCB and NDB in NSCLC patients treated with ICIs. Columns represent individual patients with DCB (green, left panel, n = 32) and NCB (grey, right panel, n = 44) and are sorted by descending TMB values. PD‐L1 expression is binned into < 1% (light purple), 1–49% (purple), and ≥ 50% (dark purple). Histology distinguishes between adenocarcinoma (blue) and squamous cell carcinoma (yellow). Smoking status is separated into ever‐ (black) and never‐smokers (pink). Concordance indicates the correlation between gene variants detected by the TMB compared with a reference molecular profiling method (further described in the Materials and methods section). TMB is shown in mutations/megabase in descending order and colored according to tertiles (from dark to light green = high to low). PFS is shown in months. Mutation frequencies are shown per gene and variant types are separated into missense (blue), truncation (red), inframe (orange), and other (yellow) variants. Patients for whom clinical data were not available are blank.