Figure 5.

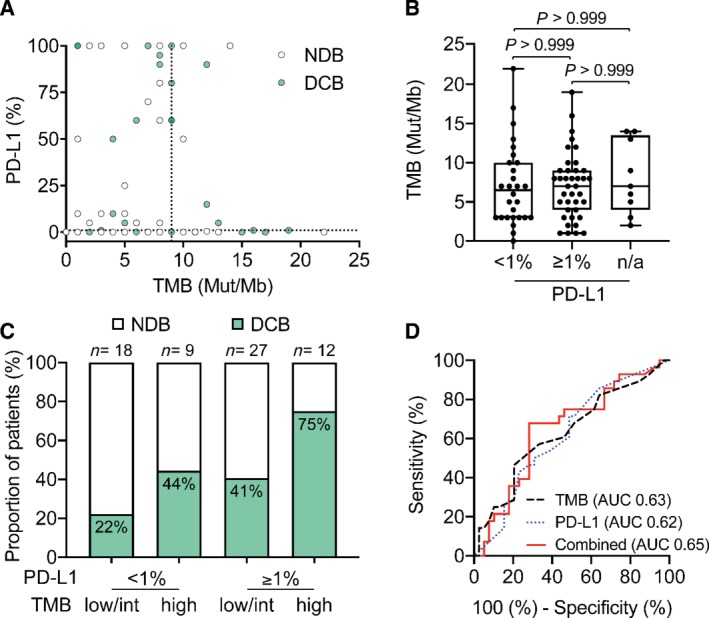
Multivariate analysis of PD‐L1 and TMB improves patient stratification into responders and non‐responders. (A) Correlation between TMB and PD‐L1 expression (n = 67, Spearman correlation r = 0.003, 95% CI −0.24 to 0.25). The dotted line indicates the cut‐off for TMB‐high classification (9 Mut/Mb). Patients with DCB are colored in green. (B) Distribution of TMB in PD‐L1‐negative (TPS < 1) (n = 28, median = 6.5 Mut/Mb), PD‐L1‐positive (TPS ≥1, n = 39, median = 7.0 Mut/Mb), and patients with unavailable data (n = 9, median = 7.0 Mut/Mb) (Dunn's multiple comparison test, all P values > 0.99). (C) Percentage of patients with DCB (green) with status of TMB‐low/int or ‐high in combination with PD‐L1 percentage < 1 or ≥ 1. (D) ROC curves for correlation of TMB (black dashed line, AUC = 0.63) and PD‐L1 expression (blue dotted line) (AUC 0.62) as single biomarkers or combined (red solid line) with DCB (AUC 0.65, 95% CI 0.51–0.78, p = 0.0395). Multivariate analysis was calculated using a linear model.
