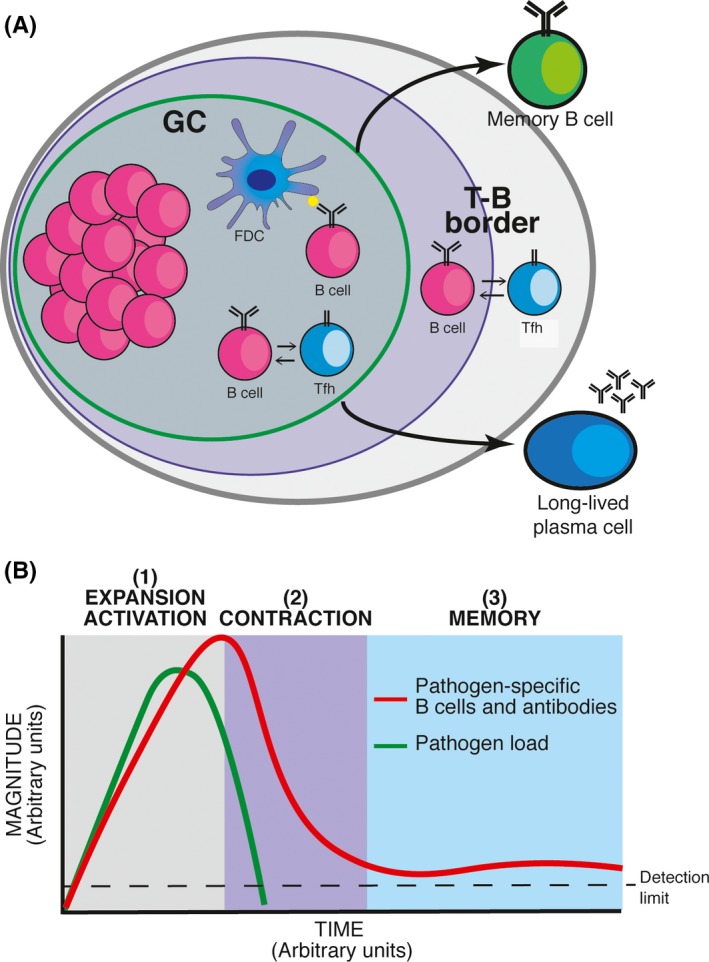
Figure 1.

Pathogen‐specific B‐cell responses. (A) Schematic representation of the germinal center (GC) B‐cell response, which results in the generation of two arms of B‐cell memory, long‐lived plasma cells and memory B cells. (B) Schematic representation of the kinetics of B‐cell responses to pathogens, showing the expansion/activation phase (1), the contraction phase (2), and the memory phase (3). FDC: follicular dendritic cell; Tfh: follicular helper T cell
