
Figure 1.
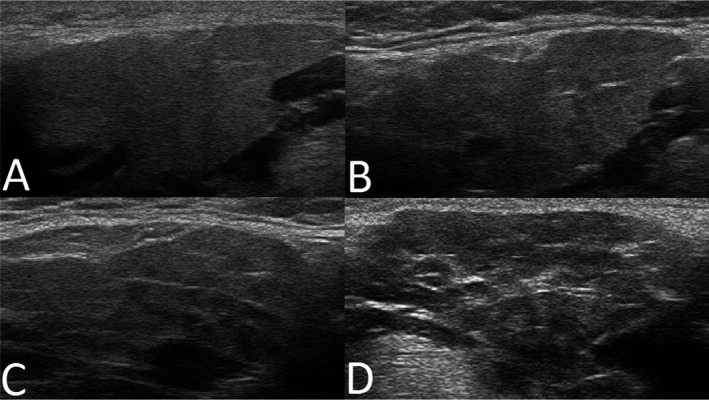
Representative major salivary gland ultrasonography images of submandibular glands, illustrating A, grade 0; B, grade 1; C, grade 2; and D, grade 3, with grades 0–1 corresponding to normal‐appearing morphology, and grades 2–3 corresponding to pathologic changes in the submandibular and parotid glands of patients with clinical symptoms of juvenile Sjögren's syndrome.