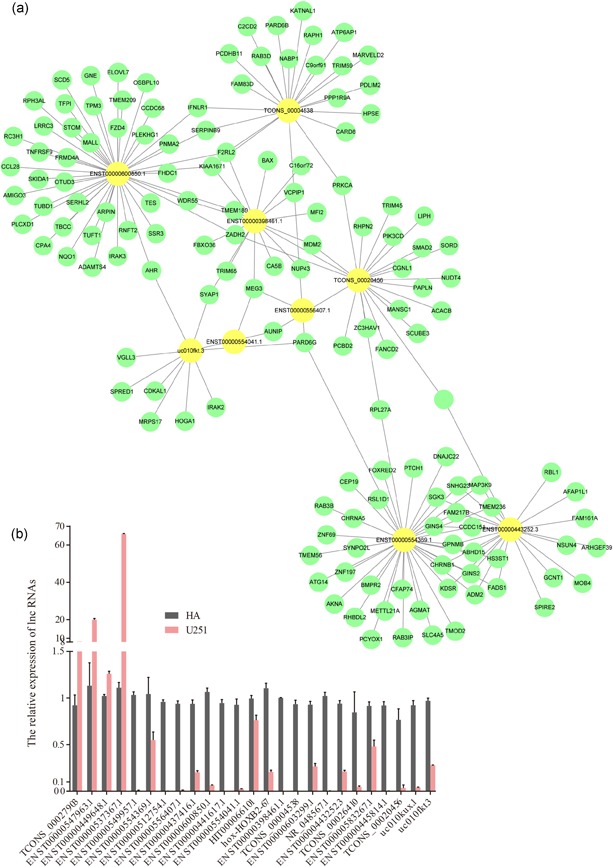
Figure 3.

The lncRNA–mRNA coexpression network and RT‐PCR confirmation of 34 differentially expressed lncRNAs. (a) The lncRNA–mRNA network graph, based on the correlation analysis between the differentially expressed lncRNAs and mRNAs, showed that differentially expressed mRNAs were associated with 17 lncRNAs. Yellow nodes represent the lncRNAs and green nodes represent the target mRNAs. (b) 38 selected lncRNAs differentially expressed were validated by quantitative real‐time PCR. Comparison of the qPCR expression fold change of 17 candidate lncRNAs in U251 cells and HA cells. The bars represent the standard error. HA, human astrocyte; lncRNA, long noncoding RNA; mRNA, messenger RNA; RT‐PCR, reverse transcription‐polymerase chain reaction
