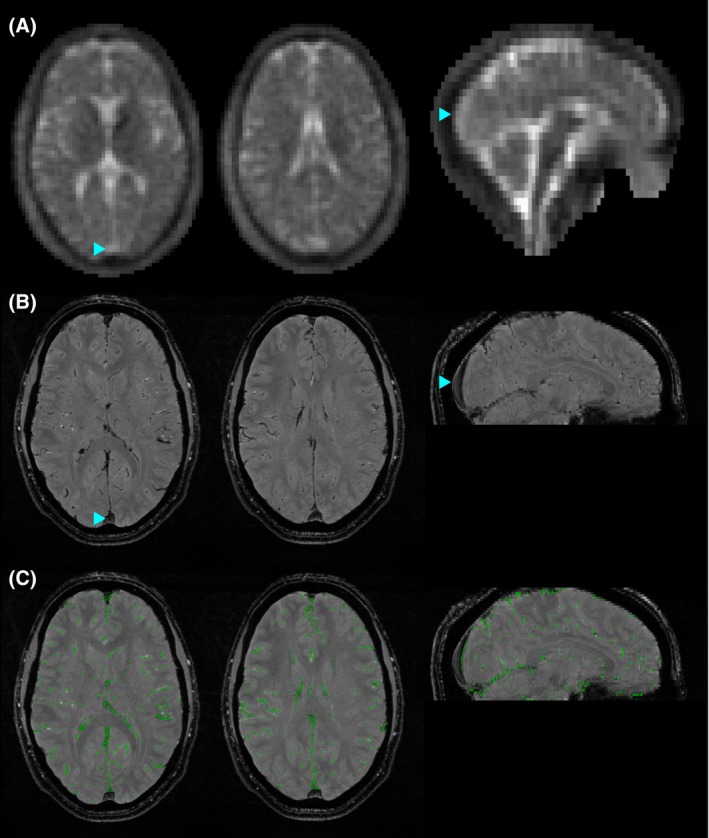
Figure 2.

Sodium signal in the superior sagittal sinus (SSS), a major vein, and demonstration of vein masking. A, Two axial slices and 1 sagittal slice of an example density‐weighted 23Na dataset, demonstrating higher sodium signal in the SSS (blue arrowhead) than the surrounding tissue. B, 1H FLASH image with veins appearing hypointense. Blue arrowheads mark the same point on the SSS as shown in (A). C, Demonstrating the binary vein mask (green) overlaid on the 1H FLASH image from which the mask is calculated. Note that the SSS is not included in the mask as its diameter is larger than the 3 mm spatial filter. The images are from a healthy 30‐year‐old male volunteer
