
Figure 3.
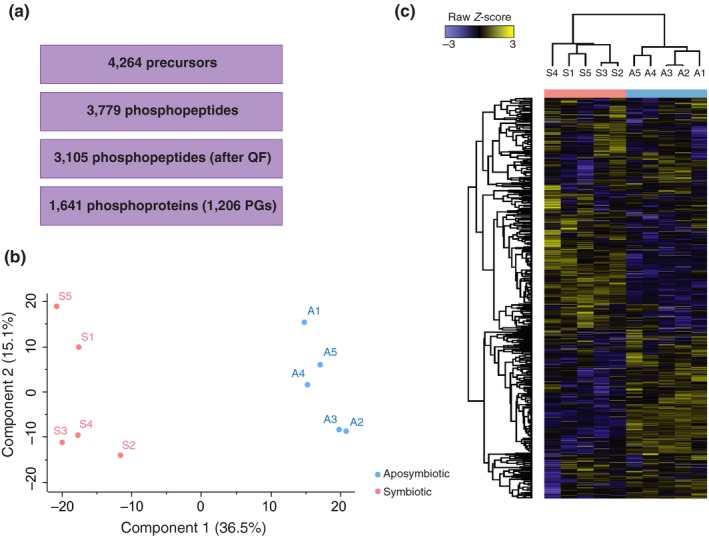
Quantification of protein phosphorylation across symbiotic conditions. (a) Number of precursor ions, phosphopeptides before and after quality filtering (QF), and phosphoproteins (grouped in PGs) consistently quantified across samples. (b) Principal component analysis (PCA) and (c) unsupervised Pearson's hierarchical clustering based on the quality filtered phosphoproteomic profiles of aposymbiotic (A, light blue) and symbiotic (S, pink) samples