
Figure 4.
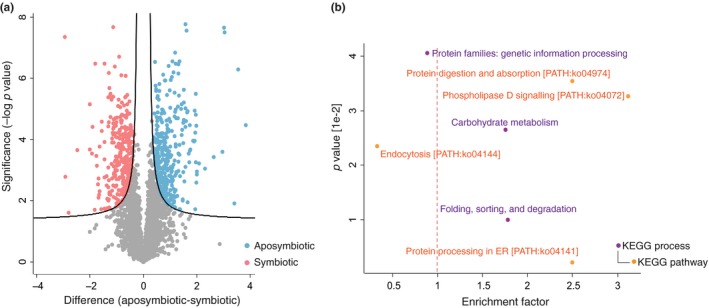
Differentially abundant phosphopeptides and enriched KEGG biological processes and signalling pathways. (a) Volcano plot representing highly abundant phosphopeptides in either symbiotic (pink, left side) or aposymbiotic (light blue, right side) Aiptasia anemones (FDR 0.01, S0 0.1). (b) Scatterplot representing KEGG processes and pathways targeted by differential phosphorylation (p < .05). KEGG terms are classified into processes (purple) and pathways (orange). Terms that are underrepresented in the analysis have an enrichment factor < 1 (left of the red dashed line)