
Figure 5.
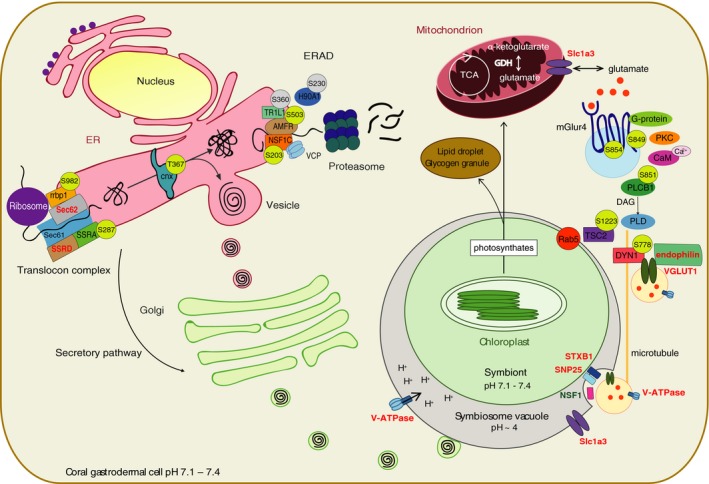
Model of a symbiotic cnidarian cell representing putative phosphorylation‐mediated regulation of the KEGG terms “PLD signalling pathway” and “protein processing in ER.” For each differentially phosphorylated protein, the phosphosite is represented in a circle as phosphorylated (yellow) or dephosphorylated (grey) in symbiotic versus aposymbiotic Aiptasia. For the sake of completeness, the model includes additional proteins that belong to the two pathways. Bold font indicates proteins that were measured but not differentially abundant. The colored font represents upregulation (red) and downregulation (green) of protein abundance in symbiosis