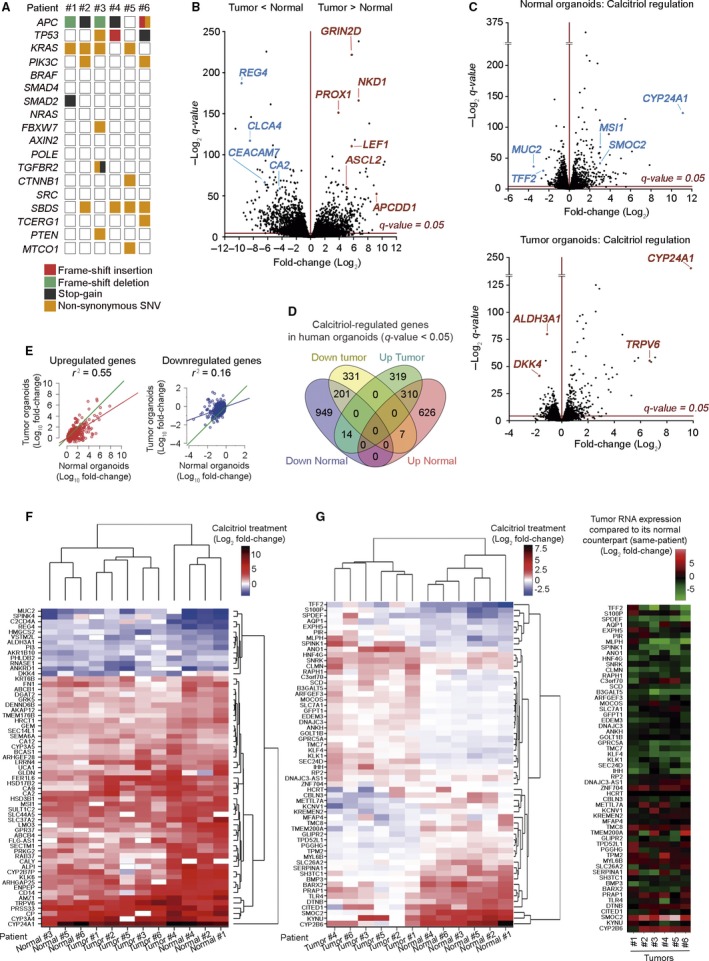
Figure 5.

Transcriptomic profile changes by calcitriol in human normal and tumor organoids. (A) Overview of the mutations found in the tumor organoid cultures of six selected patients. (B) Volcano plot comparing human normal and tumor RNA‐seq signatures from the six matched organoid cultures analyzed in (A). The x‐axis shows the fold‐change (Log2) and the y‐axis shows the q‐value (−Log2). Each dot represents a gene. Blue/red dots represent genes that are down‐ or upregulated (respectively) in tumor vs. normal organoids. Dots above the line are significant. (C) Volcano plot comparing normal (upper blot) and tumor (lower blot) organoid signatures from (B) treated with 100 nm calcitriol or vehicle for 96 h. (D) Venn diagram showing the overlap between calcitriol‐significant regulated genes in normal and tumor organoids. The number of genes included in each group is depicted and the complete list of genes is in Table S2. (E) Graphs representing the linear correlation between the effect of calcitriol on gene expression (left graph, induction; right graph, repression), computed as the ratio (Log10 fold‐change) of the RNA‐seq counts, in treated organoids over controls. Only genes significantly (FDR<0.05) regulated by the treatment in normal organoids are represented. Green line, theoretical perfect correlation (r 2 = 1). Statistical analysis was performed by Multiple r‐squared regression test. (F) Heatmap showing significant genes commonly regulated by calcitriol in matched normal and tumor organoids with an average Log2 fold‐change > 1 and expression > 4 cpm. (G) Heatmaps showing the genes with the greatest variance between sample groups of Log2 fold‐change upon calcitriol treatment in matched normal and tumor organoids (left) and tumor RNA expression of those genes compared to its normal counterpart (right).
