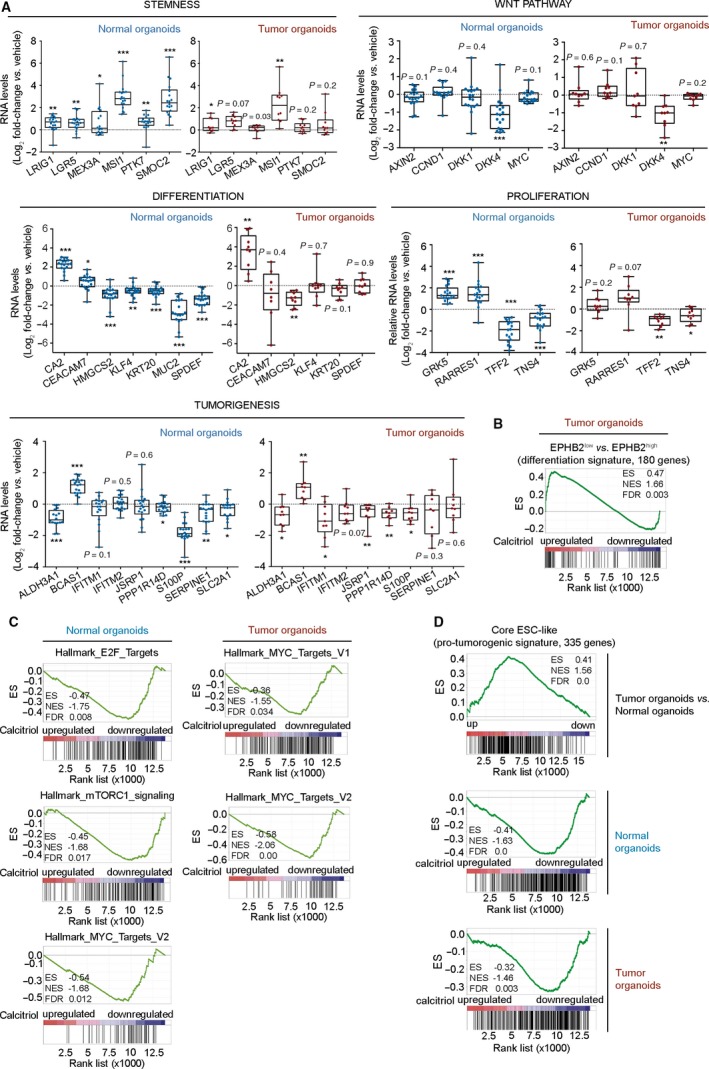
Figure 6.

Calcitriol distinctly changes gene expression profile of human normal and tumor organoids. (A) RT‐qPCR analysis of the RNA level of selected genes in an independent series of 18 normal and nine tumor organoid cultures treated with 100 nm calcitriol or vehicle for 96 h. Box plots represent median ± max/min. Statistical analysis was performed by One‐sample t‐test (normal organoids) and nonparametric Wilcoxon signed‐rank test (tumor organoids), *P < 0.05, **P < 0.01, ***P < 0.001. The exact P‐values are indicated for nonsignificant results. (B) GSEA comparing the reported human healthy colon EPHB2‐based differentiation gene signature and the RNA‐seq analysis of human tumor colon organoids treated with calcitriol. (C) GSEA comparing the proliferation‐related molecular signatures databases and the RNA‐seq analyses of human normal and tumor organoids treated with calcitriol. (D) GSEA comparing the pro‐tumorigenic signature core ESC‐like with the RNA‐seq analysis of genes up/downregulated in tumor vs. normal organoids (upper graph), and with that of normal or tumor organoids treated with calcitriol (lower graphs).
