Figure 1.

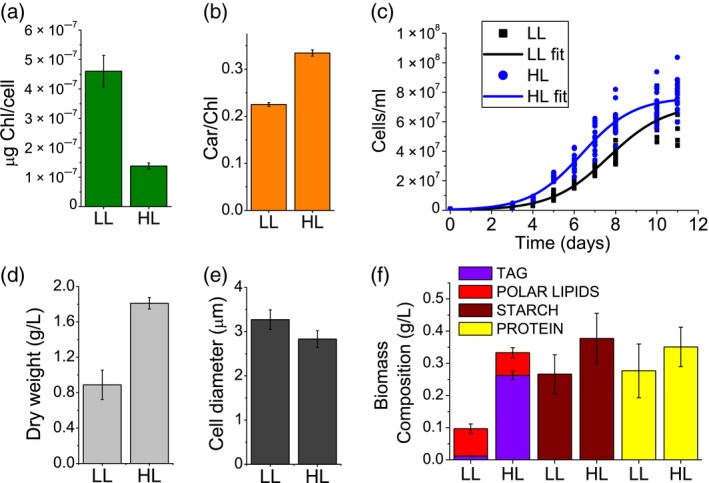
Growth curves, productivity and biomass composition of Chlorella vulgaris 211/11P in low light (LL) compared with high light (HL). (a, b) Chlorophyll (Chl) content per cell (a) and carotenoid to chlorophyll ratio (b) in LL and HL. (c) Growth curves of cells grown in LL and HL fitted by sigmoidal function (Hill function). (d) Dry weight of total biomass harvested at the end of the growth curves reported in (a). (e) Average cell diameter at the end of the growth curves reported in (c). (f) Biomass composition analysis in terms of lipids, proteins and starch. Lipid content are indicated either as triacylglycerol (TAG) or as polar lipids (PL, the sum of major membrane lipids). Error bars are reported in terms of standard deviation (n = 3 for data reported in a, b, e, f; n = 10 for data reported in (c) and (d).
