Figure 1.

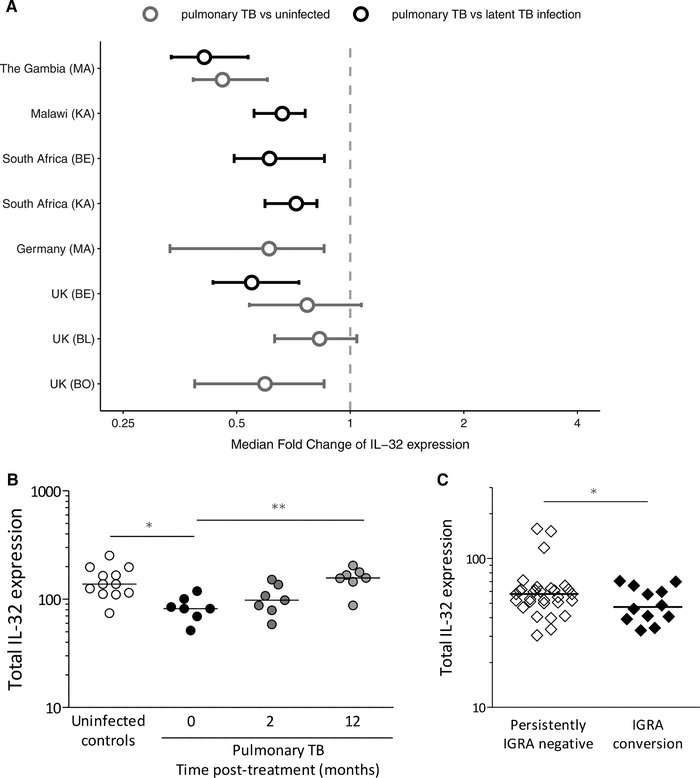
IL‐32 expression in different tuberculosis phenotypes. (A) Whole blood IL‐32 gene expression data from healthy controls, latently infected individuals, and pulmonary TB patients are presented. The data were obtained from publicly available datasets published by Maertzdorf et al. (MA), Kaforou et al. (KA), Berry et al. (BE), Bloom et al. (BO), and Blankley et al. (BL). The hollow circles represent the median fold changes of IL‐32 expression in tuberculosis patients compared to healthy controls (gray) or latently infected individuals (black), and the lines represent the 95% confidence intervals, determined by bootstrap resampling. (B) Whole blood IL‐32 expression from pulmonary TB patients (N = 7) at 0, 2, and 12 months after start of treatment is presented. Data were previously published by Berry et al., and medians are indicated. Statistical analyses of the IL‐32 mRNA levels were performed using Kruskal–Wallis tests, including the post hoc Dunn's multiple comparison tests, and Mann–Whitney U‐tests. * P < 0.05; ** P < 0.01; *** P < 0.001. (C) IL‐32 gene expression measured by RNA sequencing in whole blood of household contacts who remained uninfected (persistently IGRA negative, N = 32) and contacts who became infected after exposure (IGRA conversion, N = 12). Differential gene expression analysis of IL‐32 was performed using the R package DESeq2 with RStudio in R 3.2.4 (P = 0.018). Individual data points and medians are presented
