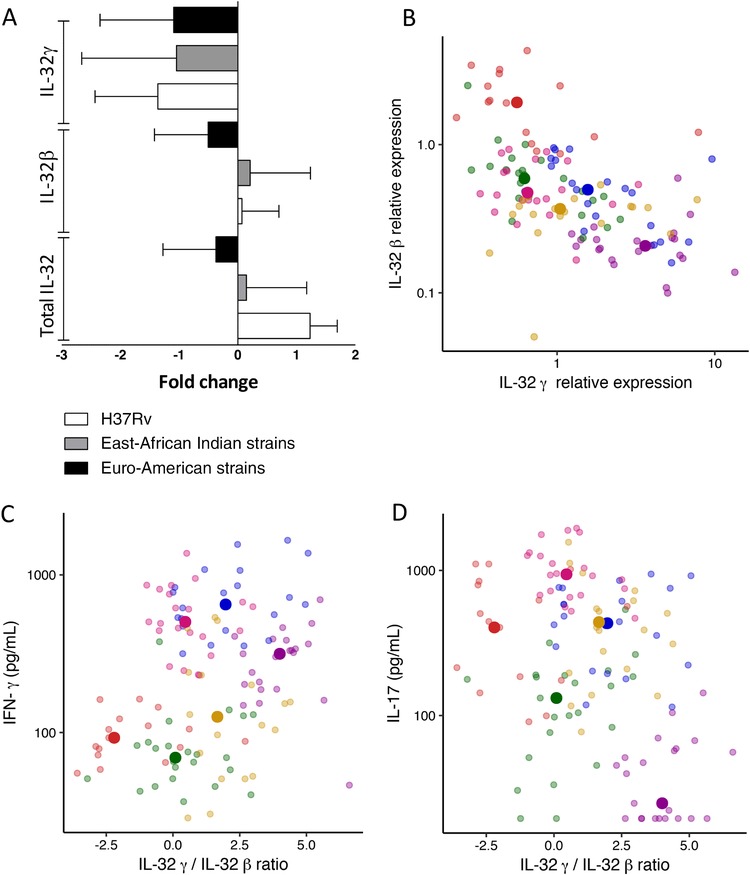
Figure 2.

IL‐32 expression in relation to cytokine production after stimulation with M. tuberculosis. (A) Total IL‐32, IL‐32β, and IL‐32γ gene expression in PBMCs from 8 different donors stimulated with M. tuberculosis for 24 h. The East‐Asian Indian strains group shows the median of 15 strains, and the Euro‐American strains group shows the median of 4 strains compared to the unstimulated control. Data are presented as median ± interquartile range (IQR). (B–D) PBMCs from 6 different donors were stimulated with 20 M. tuberculosis isolates for 24 h or 7 days. Each color represents a donor, and each dim point shows 1 individual data point. The brighter point shows the median value of 1 donor for all 20 M. tuberculosis isolates. (B) The relative expression of IL‐32γ is plotted against the relative expression of IL‐32β in PBMCs stimulated for 24 h with M. tuberculosis isolates. The levels of IL‐32β and IL‐32γ were measured using quantitative PCR and normalized against the housekeeping gene β2‐microglobulin (B2M) and the relative expression was calculated as 2(–Δ Ct ). (C–D) Concentrations of IFN‐γ (C) and IL‐17 (D) measured by ELISA after 7 days are plotted against IL‐32γ/IL‐32β ratio
