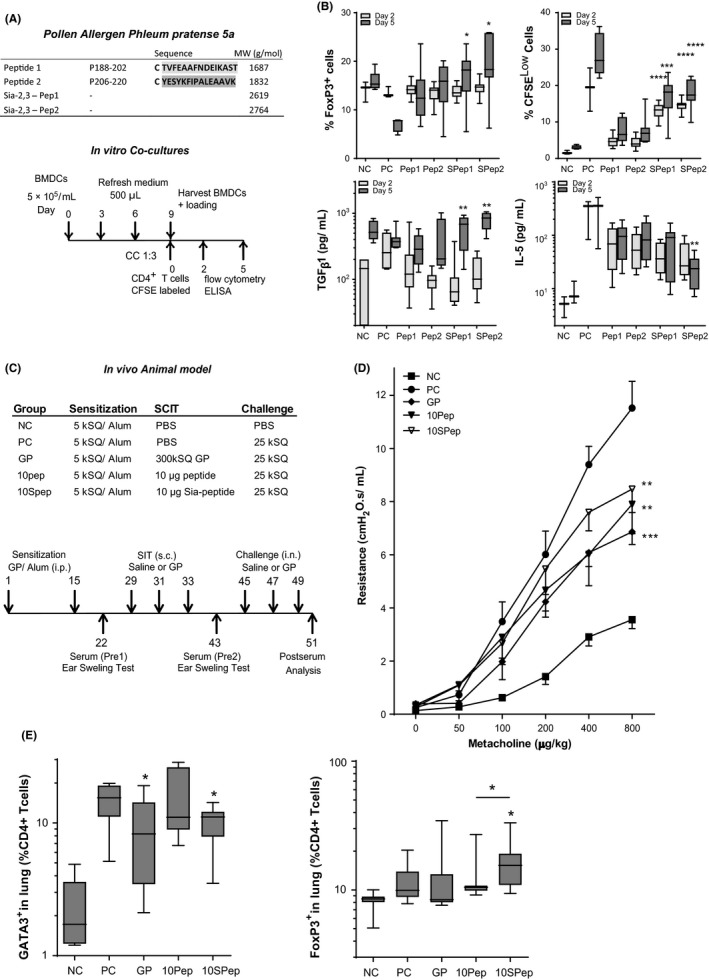
Figure 1.

A, Outline of (Sia‐) peptides 1 and 2 and co‐cultures of GP‐ or (Sia)‐peptide stimulated BMDCs with CFSE‐labeled CD4+ T cells. B, FoxP3+ T cells and CFSELow T cells (both as % of total single living CD3+CD4+ T cells) and levels of TGF‐β1 and IL‐5 pg/mL, n = 12 (mean ± SEM). C, Outline of the SCIT protocol and treatment groups. D, Airway resistance (R in cmH2O.s/mL) at day 51. E, GATA3+ and FoxP3+ T cells in lung single cells (% live cells) (mean ± SEM). *P < 0.05, **P < 0.01, and ***P < 0.005 compared to unsialylated‐peptide
