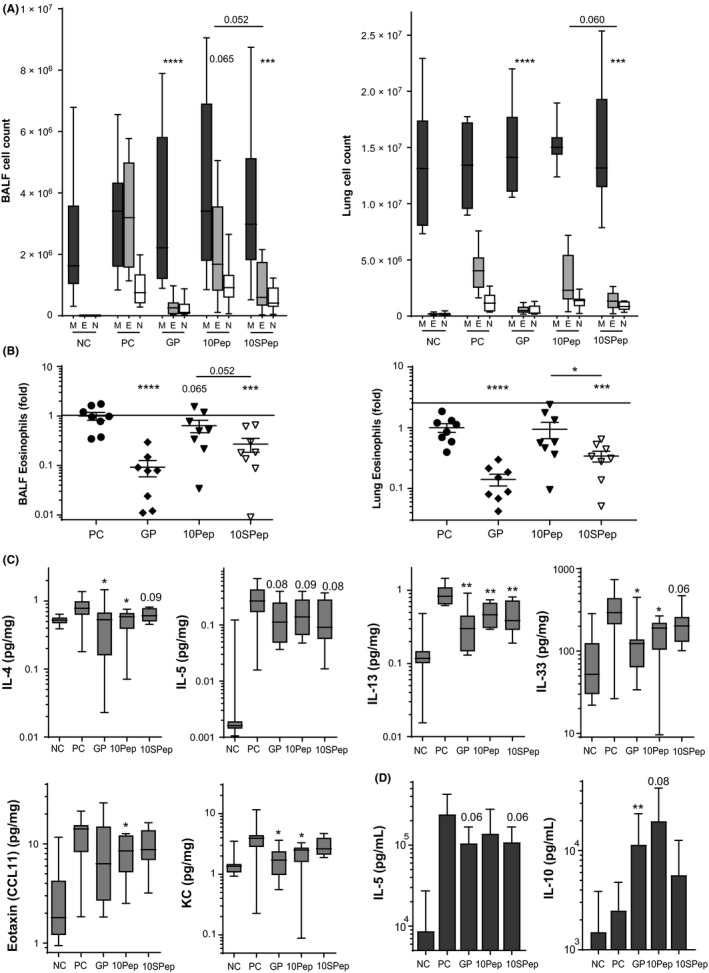
Figure 2.

A, Differential cytospin cell counts in BALF and in LUNG. M, Mononuclear cells; E, eosinophils; N, neutrophils. Absolute numbers are plotted in box‐and‐whiskers plots (min‐max). B, BALF eosinophils and lung eosinophils, both plotted as ratio of suppression (absolute eosinophils/average PC eosinophils; mean ± SEM). C, Levels of IL‐4, IL‐5, IL‐13, IL‐33, eotaxin, and KC (pg/mg) quantified via Luminex in lung tissue. D, Net levels of IL‐5 and IL‐10 measured in restimulated lung cells, calculated as the concentration after restimulation (30 μg GP for 5 d) minus unstimulated control (mean ± SEM, n = 8)
