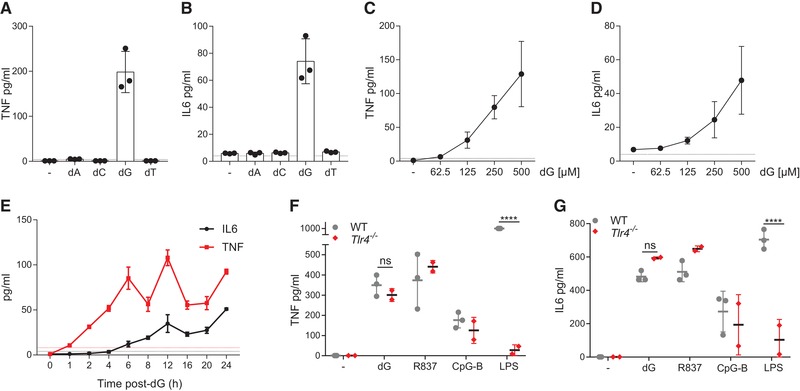
Figure 1.

BMDMs secrete cytokines upon dG treatment. (A, B) BMDMs were treated with 0.5 mM of the indicated dNs for 24 h. TNF (A) and IL6 (B) concentrations in supernatants were determined by ELISA. (C, D) The experiment in (A,B) was repeated with the indicated concentrations of dG. (E) BMDMs were treated with 0.5 mM dG for the indicated periods of time and supernatants were analysed as in (A, B). (F, G) BMDMs of the indicated genotypes were treated with 0.5 mM dG, 2.5 µg/mL R837, 2.5 µg/mL CpG‐B DNA, or 2.5 ng/mL of LPS for 24 hours. Supernatants were analysed as in (A, B). Pooled data from biological replicates (BMDM cultures originating from individual mice, n = 3 for WT and n = 2 for Tlr4−/−) are shown with mean ± SD. Data are representative of three (A, C) or two (B, D–G) independent experiments. Dashed lines represent detection limits. p‐values determined with two‐way ANOVA are indicated. ns, p 0.05; ****, p < 0.0001.
