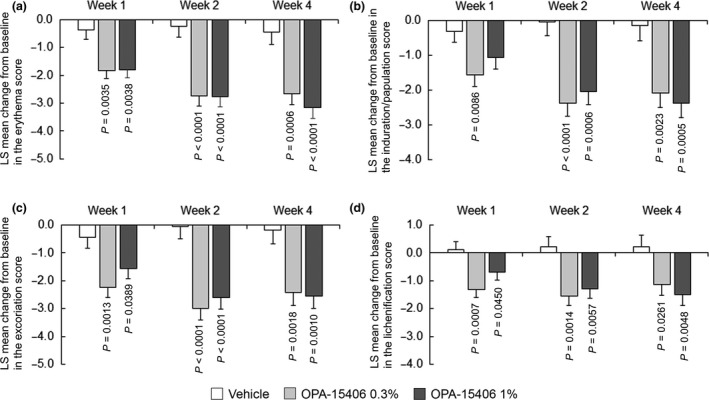
Figure 4.

Least square mean change in the Eczema Area and Severity Index subscale scores from baseline at each examination time point: (a) erythema score; (b) induration/papulation score; (c) excoriation score; (d) lichenification score. In the vehicle, OPA‐15406 0.3% and OPA‐15406 1% groups, 24, 24 and 25 patients, respectively, were examined at week 1; 21, 24 and 24 patients, respectively, were examined at week 2; and 18, 23 and 24 patients, respectively, were examined at week 4. P‐values are for the comparison between each OPA‐15406 group and the vehicle group. LS, least square.
