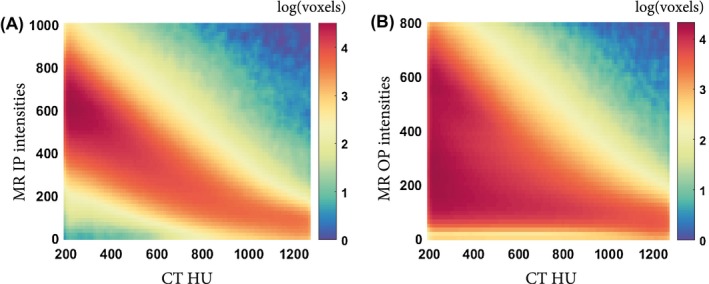
Figure 3.

Two‐dimensional histograms between MRI intensities and CT Hounsfield units for voxels corresponding to cortical bone (HU > 200). The correlation between bone voxel intensities in CT scans and MR images is stronger in in‐phase (IP) images (A) than in opposed phase (OP) images (B)
