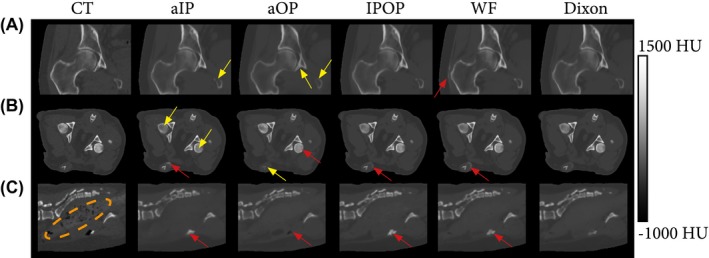
Figure 5.

Computed tomography and synthesized CTs (sCTs) generated per input configurations for 3 subjects. The Dual configuration was omitted, as it was very similar to IPOP. A, Coronal view of the right femoral head and acetabulum of a human patient (subject 1). B, Transversal view of the pelvic anatomy of a canine subject (subject 1). C, Sagittal view of the spine of a canine subject (subject 12). Yellow arrows indicate hypo‐intense bone regions; red arrows indicate hyperintense regions; and the orange encircled area indicates the bowels that do not contain any air pockets on the sCTs
