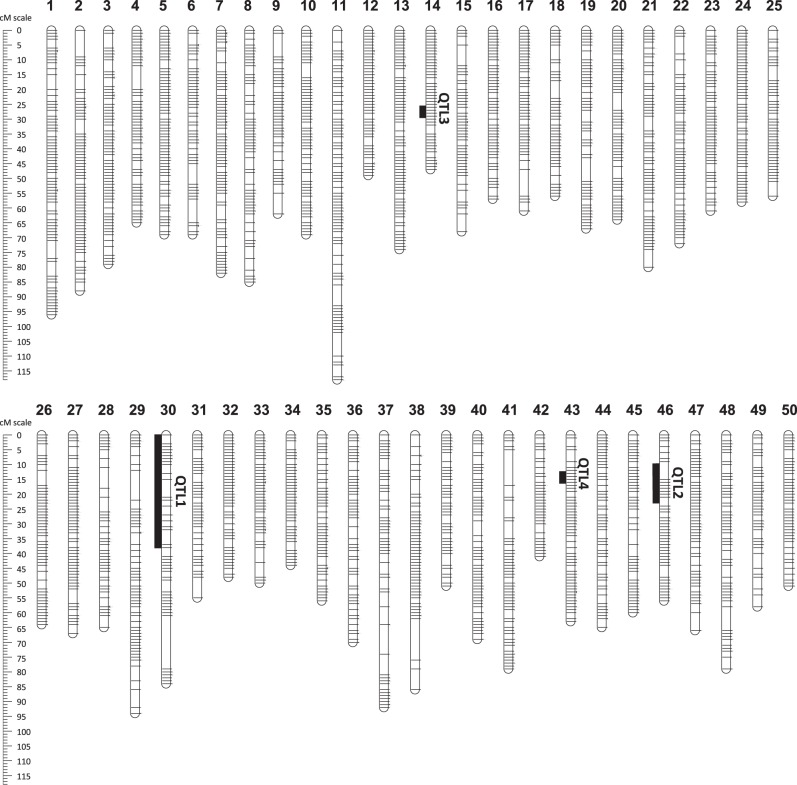
Fig. 2.
Sex-averaged genetic linkage map for Cyprinus carpio based on GBS markers from two mapping families (MF2 and MF3). Each bar is 1 out of 50 linkage groups. Unique marker positions (clusters of markers mapping to the same genetic position) are presented by a line across the LG bar. All LGs are scaled uniformly and a cM scale is present to the left. Position of the four CyHV-3 survival QTLs are shown next to their respective LGs and the mapping intervals of QTLs 1 and 2 are marked by black lines

