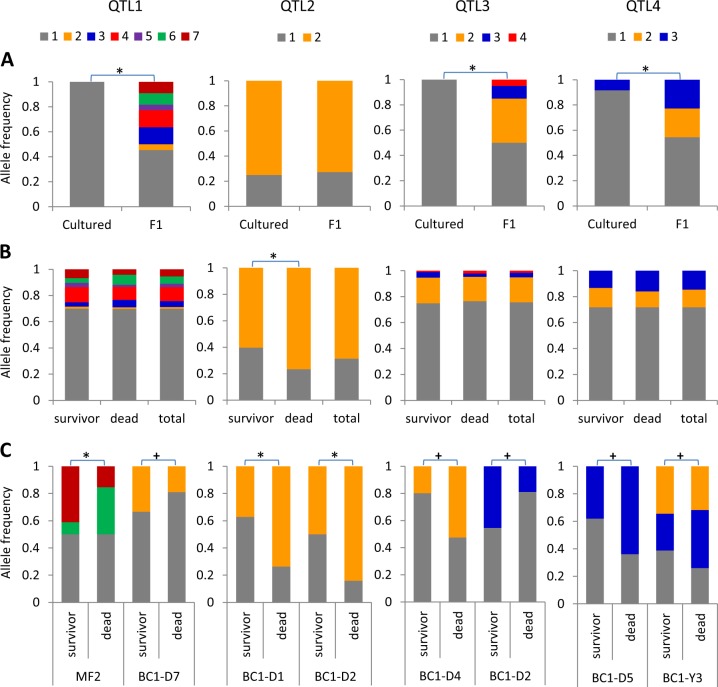
Fig. 6.
Prevalence and source of CyHV-3 survival QTL alleles. All plots depict allele frequency distribution (Y axis) by different fish groups (X axis). Different QTL alleles are marked by different colors (legend on top for each QTL). Significant differences (χ2 likelihood ratio, P < 0.05) between groups are marked by asterisks and suggestive differences (χ2 likelihood ratio, 0.1 ≥ P ≥ 0.05) are marked by plus signs. a Distribution of alleles by genetic background (cultured or F1) in the parents of all families together. b Distribution of alleles by survival phenotype (survivor/dead) in progeny of all families together. c Example distributions of alleles by survival phenotype in specific families for which a significant QTL effect was found. For each QTL, individuals are grouped by family and survival phenotype. Note that for common alleles (QTL2), the difference between genetic backgrounds was insignificant (in a) whereas differences between survivor and dead were significant overall progeny together (in b) and in half of the families (examples in c). For rare alleles (QTLs 1, 3, and 4), differences between genetic backgrounds were significant (in a) whereas differences between survivor and dead were insignificant overall progeny (in b)

