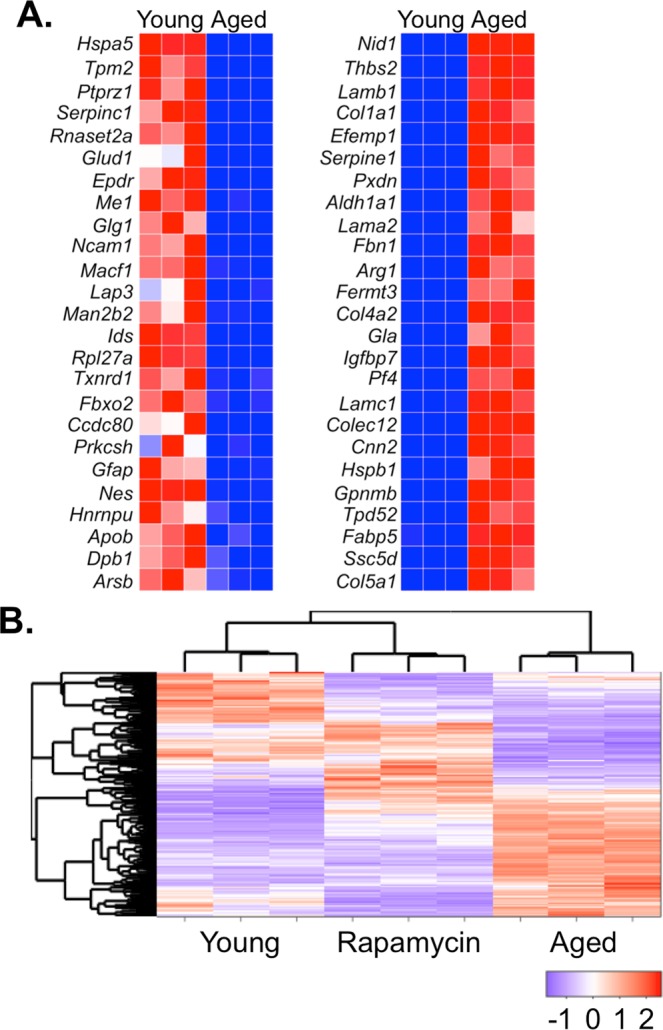
Figure 5.

Proteomic analysis of young and aged astrocyte EV proteome. (A) Top 25 differentially expressed proteins (as listed by gene name) following quantitative analysis of protein abundance between young and aged astrocyte-derived EVs. (B) Differential expression and hierarchical cluster analysis between replicates using protein-wise exact tests. An FDR cutoff of 0.01 was used to identify significantly differentially expressed proteins.
