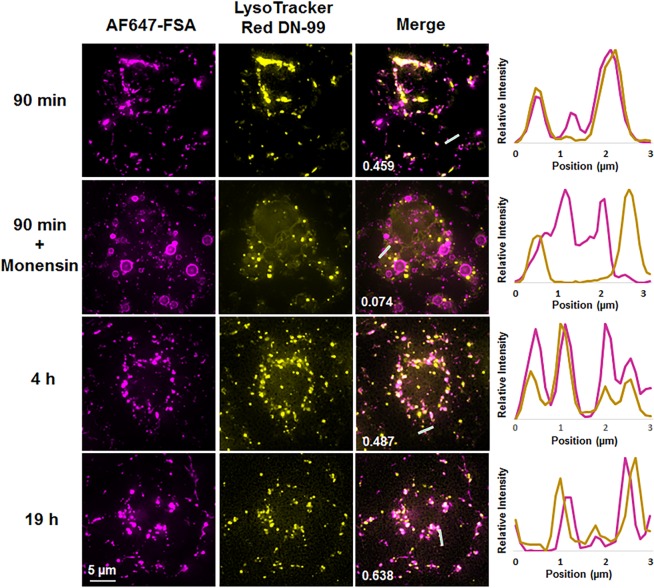
Figure 3.
Time-lapse endocytosis of AF747-FSA in the presence or absence of monensin and LysoTracker. LSEC cultures were preincubated with LysoTracker (yellow) and challenged with AF647-FSA (magenta) in the absence or presence of monensin (10 µM). The uptake was monitored in real-time by DV overnight. Colocalization values for FSA and LysoTracker (shown in merged images) are Pearson’s correlation coefficients calculated using the Costes threshold in Volocity Quantitation software. Images represent maximum intensity projections of 4–9 µm 3D z-stacks. Right panel shows randomly selected line profiles within the cells, indicating the degree of colocalization of the two probes. The results are representative of experiments performed with cells isolated from 4 animals, and included 7 culture dishes, 49 fields of view, and approximately 350 cells; of which 2 animals, 2 culture dishes, 17 fields of view, and approximately 100 cells were in the presence of monensin).

