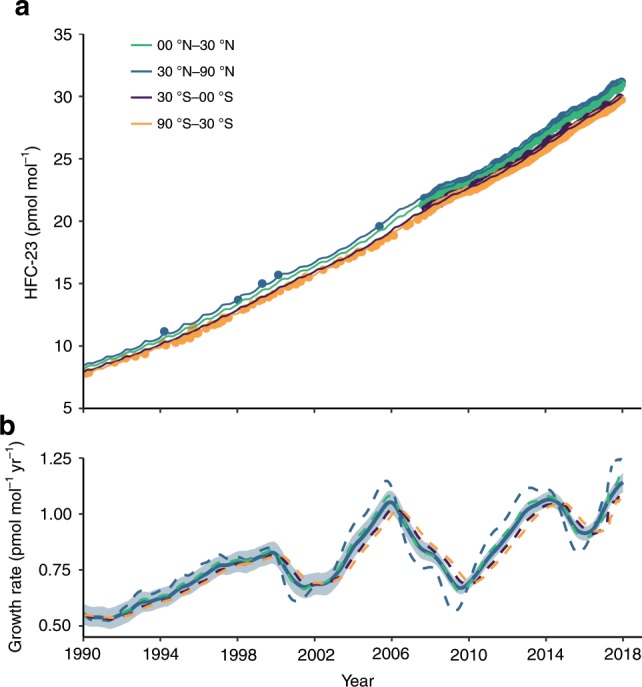
Fig. 2. HFC-23 observations, model-derived mole fractions and growth rates.

a Modelled atmospheric HFC-23 mole fractions in pmol mol for the four equal-mass latitudinal subdivisions in the 12-box model based on in situ measurements at the core background measurement sites (points), northern hemispheric flask samples (blue circles; only shown prior to 2007) and Cape Grim Air Archive data (orange circle, only shown prior to 2007). b Model-derived annual HFC-23 growth rates (global - blue solid line with 1-sigma uncertainty indicated by shading; dashed lines show semi-hemispheric growth rates) in pmol mol yr.
