
Figure 4.
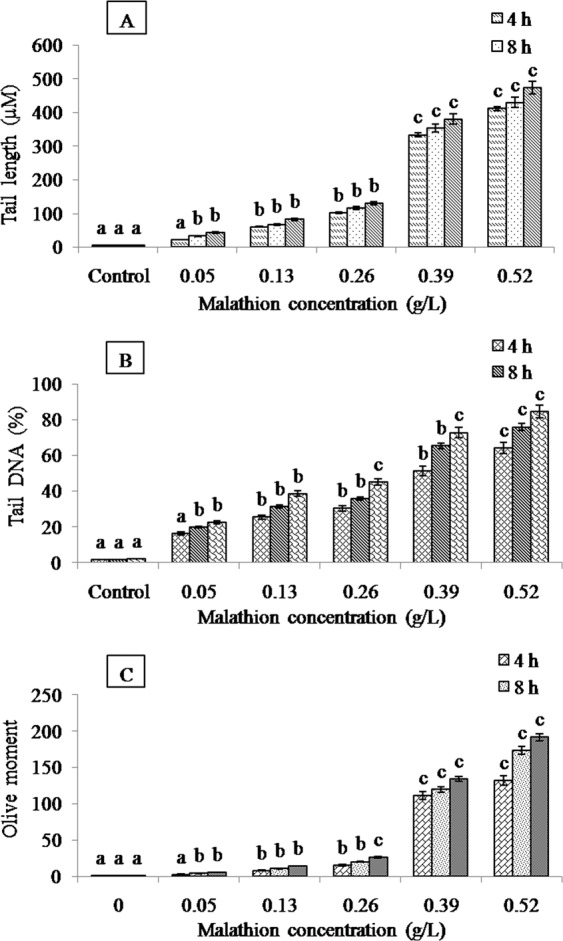
DNA damage in root cells of A. cepa L. under different concentrations of malathion at different treatment periods (significant at p ≤ 0.05). Effect of malathion on (A) tail length, (B) tail DNA and (C) olive moment.
Official websites use .gov
A
.gov website belongs to an official
government organization in the United States.
Secure .gov websites use HTTPS
A lock (
) or https:// means you've safely
connected to the .gov website. Share sensitive
information only on official, secure websites.
DNA damage in root cells of A. cepa L. under different concentrations of malathion at different treatment periods (significant at p ≤ 0.05). Effect of malathion on (A) tail length, (B) tail DNA and (C) olive moment.