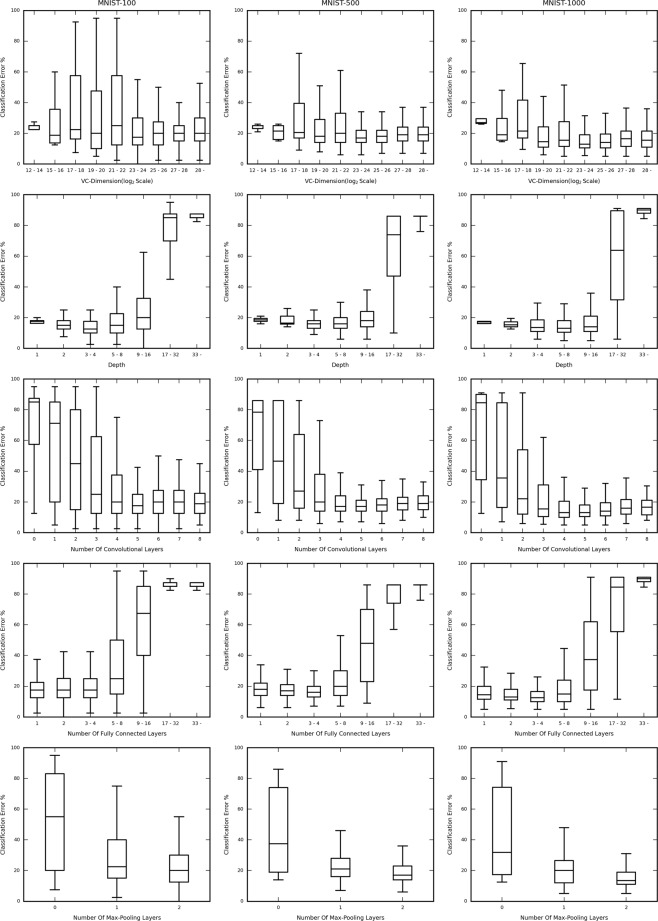
Figure 5.
Box and whisker plots showing the classification error for each network structure against the structural hyperparameters (i.e. VC-dimension, Depth, Number of Convolutional Layers, Number of Fully Connected Layers and Number of Max-Pooling Layers) for MNIST dataset of different sample size. Notice the similarity in the trends followed for each subset, indicating that the effect of the structural attributes on the performance of each structure, for each subset is similar, indicating that, the optimally performing structures is highly data-driven.

