
Fig. 2.
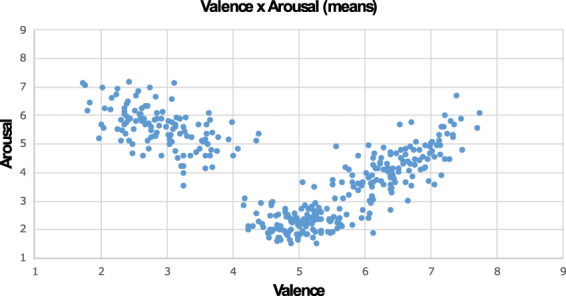
Scatterplot of the interaction between valence and arousal scores of each video. The average valence score is reported on the X axis, while the average arousal score is reported on the Y axis for each video.
Official websites use .gov
A
.gov website belongs to an official
government organization in the United States.
Secure .gov websites use HTTPS
A lock (
) or https:// means you've safely
connected to the .gov website. Share sensitive
information only on official, secure websites.
Scatterplot of the interaction between valence and arousal scores of each video. The average valence score is reported on the X axis, while the average arousal score is reported on the Y axis for each video.