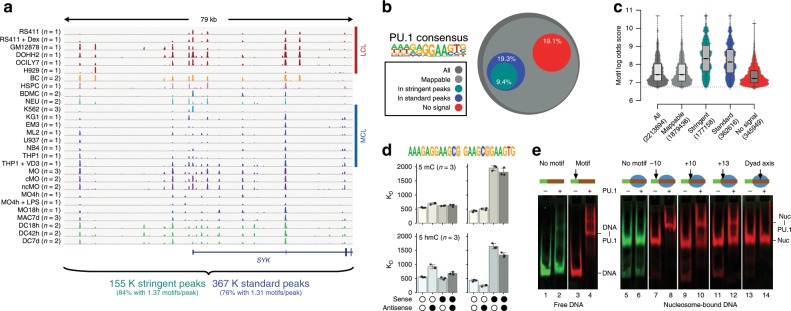
Fig. 1. PU.1 occupancy in vivo and binding constraints in vitro.
a Comparison of PU.1 ChIP-seq data across various human lymphoid and myeloid cell lines (LCL and MCL, respectively) and primary cells (BC B cells, BDMC breast skin-derived mast cells, cMO classical MO, DC dendritic cells, HSPC hematopoietic stem and progenitor cells, MAC, macrophages, MO monocytes, ncMO non-classical MO, NEU neutrophils) at an exemplary locus. For replicated data sets (as indicated), averaged coverage tracks are shown. Total motif occurrences in standard and stringent peaks are summarized below the tracks. b Fraction of PU.1 motifs residing in either standard or stringent PU.1 peaks (3.61 × 10⁵ and 1.77 × 10⁵, respectively) compared with all motif occurrences (2.21 × 10⁶) across the genome, motifs filtered for mappability (1.88 × 10⁶), as well as motifs that showed no evidence of binding (<3 per 107 reads within 200 bp motif-centered window) across all samples (no signal, 3.48 × 10⁵). c Distribution of motif scores across total occurrences, mappability-filtered motifs, motifs in peaks, and no-signal motifs. d Microscale thermophoresis-derived dissociation constants (KD values, bars represent the mean of n = 3 experiments ± SD, individual data points are shown as black dots) for the interaction between recombinant full-length PU.1 and the indicated double-stranded oligonucleotides representing PU.1 motifs with a high motif log odds score (left panels, 9.4; right panel 8.8). Open circles indicate unmethylated cytosines. Black circles represent methylated or hydroxymethylated cytosines (top panels, 5mC or bottom panels, 5hmC, respectively). e Gelshift assays demonstrating position-dependent binding of PU.1 to nucleosome-associated DNA. The relative position of the PU.1-binding site (arrow) to the nucleosome boundary is indicated. Nucleosomes are positioned by the 601 nucleosome-positioning sequence marked in red. The positions of free DNA (DNA) and nucleosomes (nuc), as well as of DNA-PU.1 and nuc-PU.1 complexes are indicated. a–d Source data are provided as a Source Data file.

