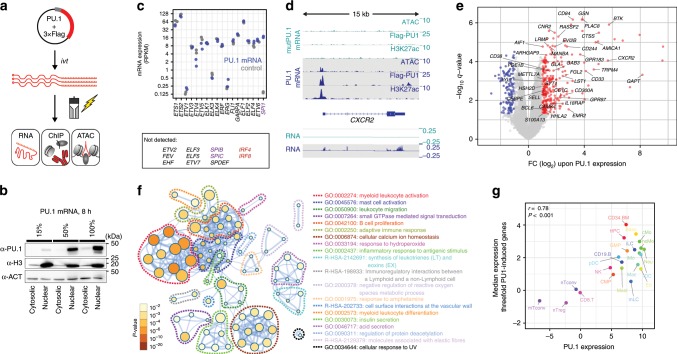
Fig. 2. Transient PU.1 expression induces a myeloid expression program.
a Schematic of the experimental setup. b Immunoblotting confirming the translation and nuclear location of full-length PU.1 in transfected cells using increasing amounts of IVT mRNA. c Relative mRNA expression levels of ETS family members in PU.1-expressing or control cells measured by RNA-seq (n = 2 each). d Example tracks for a PU.1-activated gene. Coverage represents the mean of n = 3 or n = 2 experiments for ATAC/ChIP-seq or RNA-seq data, respectively. e Volcano plot of significantly PU.1 up- or downregulated genes (red or blue, respectively). Genes with known function in myeloid or B-cell biology are labeled. f Metascape-derived network of Gene Ontology (GO) terms associated with PU.1-induced genes in CTV-1 cells. The significance of enrichment of a particular term is depicted with the log10 of the p-value and indicated by node coloring. g Comparison of median expression levels of PU.1-induced genes (threefold) with PU.1 expression levels across various human blood cell types data based on CAGE (Cap Analysis of Gene Expression) expression data from the FANTOM Consortium35. Related cell types in the hematopoietic tree share similar colors. The Pearson’s correlation as well as the corresponding p-value are indicated. b, c, e–g Source data are provided as a Source Data file.

