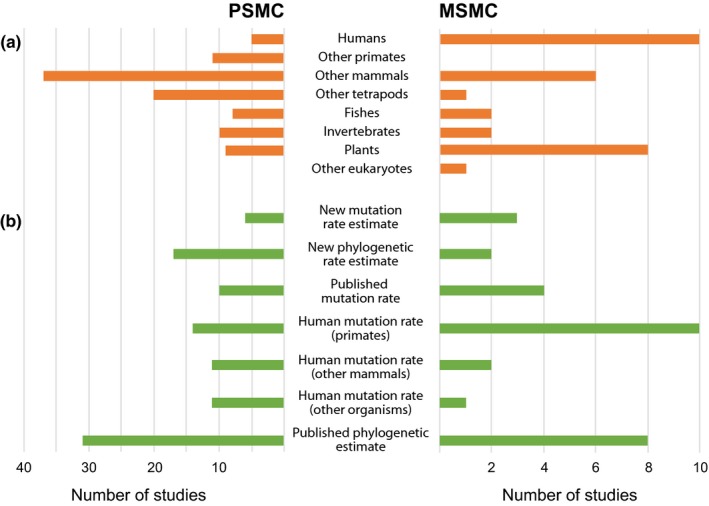
Figure 3.

Data from random samples of 100 studies that implemented the pairwise sequentially Markovian coalescent (PSMC) method and 30 studies that implemented the multiple sequentially Markovian coalescent (MSMC) method. (a) Taxonomic affiliations of the organisms studied. (b) Source of mutation rates used to scale the demographic plots. The choice of mutation rate affects the scale of the horizontal axis and the estimate of the effective population size, but does not affect the qualitative shape of the plot. For example, a higher mutation rate will cause the estimated population size to be scaled down linearly and will shift the curve closer to the present. Details of the 130 studies surveyed are provided in Appendix S1 on Dryad (https://doi.org/10.5061/dryad.0vt4b8gv2)
