
Figure 2.
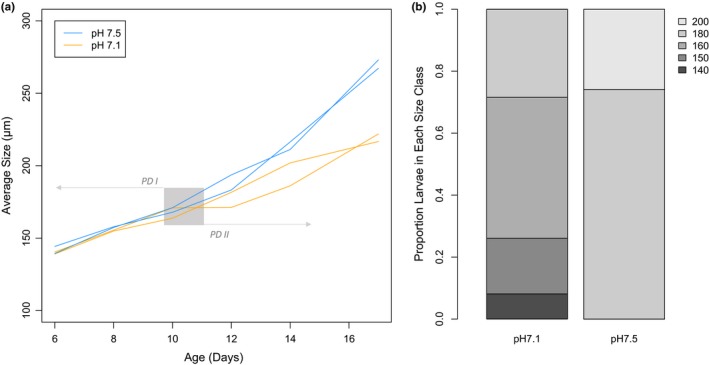
Growth curves of larvae from day 6 through 17 of development (a) and proportion of larvae in each size class (µm) on day 17 at pH 7.1 and 7.5 (b). Each individual tank in which larvae were reared is represented by a single line in panel a. Larval growth curves in tanks at pH 7.1 are orange and pH 7.5 tanks are in blue. The gray area indicates the larval transition from prodissoconch I (PD I) to II (PD II) (Goodwin & Pease, 1989)