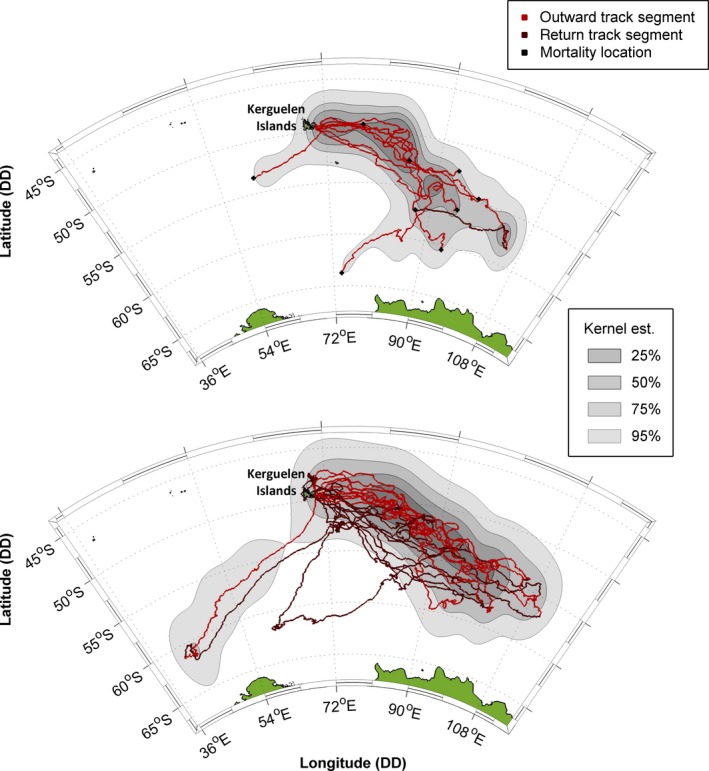
Figure 2.

Spatial distributions of (a) non‐survivors and (b) survivors. Lighter red track portions represent outward trip phases (until death or distal location) and dark red return phases. Graduated gray polygons show kernel densities at the 25%, 50%, 75%, and 95% levels, using, for non‐survivors (a), all filtered state‐space model (SSM) locations and, for survivors (b), filtered SSM locations from outward trip phases only (Supporting Information S.5). In plot (a), black markers indicate mortality events
