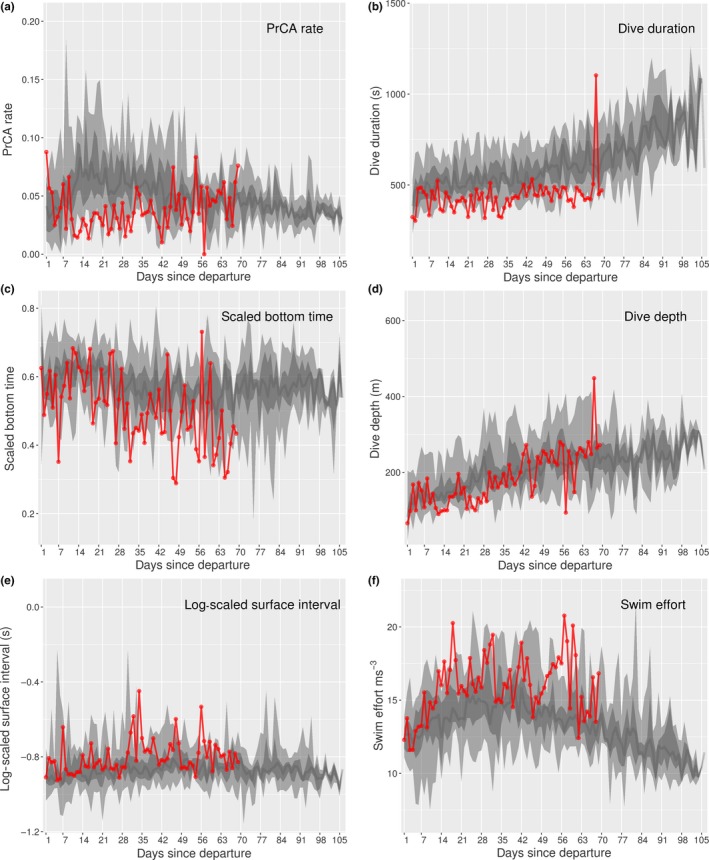
Figure 6.

Time series behaviors for individual 140078. Daily values (red) for (a) mean prey catch attempt (PrCA) rates, (b) maximum dive durations, (c) mean scaled bottom times, (d) maximum dive depths, (e) mean log‐scaled surface intervals, and (f) mean swim efforts. Large light gray bands represent concurrent 2.5%–97.5% quantiles of survival datasets, nested dark gray bands the 25%–75% quantiles, and dark gray lines the median
