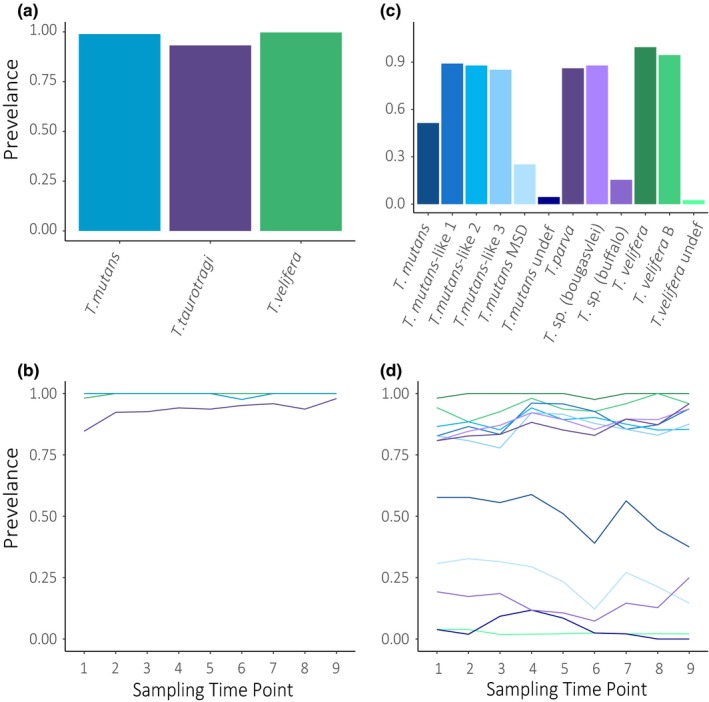
Figure 3.

Prevalence of Theileria communities. The overall prevalence of Theileria spp. over the entire study and at each sampling time point for each clade (a, b) and subtype (c, d). Note: Colors for each taxon are identical in bar plots and line graphs
